- Dead Ball Analytics
- Posts
- What xG Doesn't Tell You: The Secret 'Damage Score' of a Pass
What xG Doesn't Tell You: The Secret 'Damage Score' of a Pass
Stop looking at pass accuracy. It’s time to measure the chaos.
Dead Ball Analytics
April 13, 2026
Hello friends! It’s great to be back in your inbox.
First of all, sorry for the long break. We’d love to say we were on a secret scouting mission in South America, but the truth is just life. Between moving houses, insane project deadlines, and some tough family health stuff, the “free time” we usually spend on sharing content simply evaporated. When you’re a tiny team of two, sometimes you have to step back, breathe, and wait for the right moment to get back to the lab. Well, that moment is now. We’ve officially incorporated Dead Ball Analytics, and we’ve got a lot to catch up on. Let's get started. 🎸
The Real Question: How Do You Actually Break a Defense?
We’ve all heard the famous quote from Gary Lineker: “Football is a simple game. Twenty-two men chase a ball for 90 minutes, and at the end, the Germans always win.” It’s a neat summary of the game, but if you spend enough time around the modern ‘data nerds,’ you start to hear a much more ironic version: “Football is a simple game where 22 players run for 90 minutes, and in the end logic goes out the window”. For years, we’ve been trying to “drive with a dashboard,” obsessing over possession, chance creation, xG, final third actions, etc. But there’s often a gap between how we understand the game through data and what actually happens on the pitch. We’ve been so focused on the ‘what’ that we’ve completely missed the ‘how’.
Passing is the most common action in a typical football match, and it dictates the tempo of the game. But despite its ubiquity, we only see a fraction of it. The real question isn’t ‘Did the pass reach the target?’ The real question is: ‘How do teams actually break a defensive structure?’ In our latest research at Dead Ball Analytics, we decided to stop designing for the dashboard and start designing for the decision. We’ve moved beyond the “event” to find out the hidden patterns of progression. In this post, we discuss the first part of our research: The Team Perspective. We’ll show you, using tracking data, how a single pass can do more than progression. It can fundamentally break structure, while also revealing which teams at the 2022 FIFA World Cup dominated this area. In Part 2, we’ll focus on names, diving into the specific playmakers and partnerships that are actually breaking the lines and redefining how we see progression.
💡Curious about the 'how' behind the 'what'? Check out our full preprint on ArXiv for the deep technical framework: 👉 [Here]
The Problem: Why Traditional Stats Only Tell Half the Story
As football fans, we see a lot of stats all the time: ‘Pass Completion Rate’, ‘Expected Goals (xG)’, ‘Final Third Entries’, and so on. These metrics have undeniably enriched our understanding of the game, offering quantitative insights into player performance and team effectiveness. However, they often miss the mark when it comes to the real tactical battle happening in every possession. They are, in many ways, too simple. They tell us what happened, but rarely capture what it actually did to the defense, how it stretched, manipulated, or destabilized the opponent. Consider this: a simple 5-meter pass between İbrahim Konaté and Virgil van Dijk in their own half might have a 100% completion rate, but does it genuinely advance the team’s attacking purpose or pose any real threat to the opponent? Probably not. It’s a safe pass, meant to maintain possession, but with minimal structural impact. On the other hand, a smart pass from Pedri that breaks through two defensive lines is riskier and more likely to get intercepted, but when it comes off, it can completely disrupt the opponent’s defensive shape out of balance. Traditional metrics often struggle to differentiate between these two scenarios, treating all completed passes as equally valuable.
This is where our research comes in. We wanted to quantify the structural impact of a pass, how it changes the defensive shape, creates new attacking opportunities, and progresses the ball into dangerous areas. To do that, we had to move beyond simple event data and use tracking data, which captures the precise (x,y) coordinates of every player and the ball 30 times per second, allowing us to reconstruct the dynamic spatial relationships on the pitch at any given moment. It’s like having a hawk-eye view of every move, capturing the non-linear nature of football.
Our Framework: The Three Pillars of a Pass, Quantifying Tactical Impact
We developed a novel composite metric called Tactical Impact Value (TIV) to understand the structural effect of a pass. Think of TIV as the “Defensive Damage Score” of a pass. It is a single number that reflects how effectively a pass destabilizes the opponent’s defensive organization. TIV is built upon three complementary structural metrics, each capturing a different mechanism through which passes interact with the defensive structure.
1-Line Bypass Score (LBS): Simply quantifies the number of defenders effectively “taken out” of the play. A defender is bypassed if they are positioned between the passer and the opponent’s goal but end up behind the receiver after the pass.
Tactical Interpretation & Why it Matters
This metric directly assesses a pass’s ability to break defensive lines. A high LBS means the pass has successfully cut through a layer of defense, forcing the opponent to react and reorganise.
2-Space Gain Metric (SGM): Measures the increase in available attacking space around the receiver compared to the passer’s initial position. This is calculated based on defensive density and the compactness of the defensive block.
Tactical Interpretation & Why it Matters
This metric highlights a pass’s capacity to open up new attacking channels. A high SGM indicates the pass has moved the ball into a zone with significantly lower defensive pressure, creating “breathing room” for the receiver and potentially exploiting gaps between defensive zones. It’s about finding and exploiting the “pockets” of space that open further progression.
3-Structural Disruption Index (SDI): It captures the degree to which the defensive “shape” is stretched, shifted, or distorted by the pass. It measures the change in the ball’s displacement relative to the defensive centre.
Tactical Interpretation & Why it Matters
SDI quantifies how strongly a pass forces the opponent to react and re-adjust their formation. A high SDI means the pass has caused significant deformation in the defensive structure, forcing players out of position and creating imbalances that can be exploited by subsequent actions. It’s about making the defence uncomfortable and reactive.
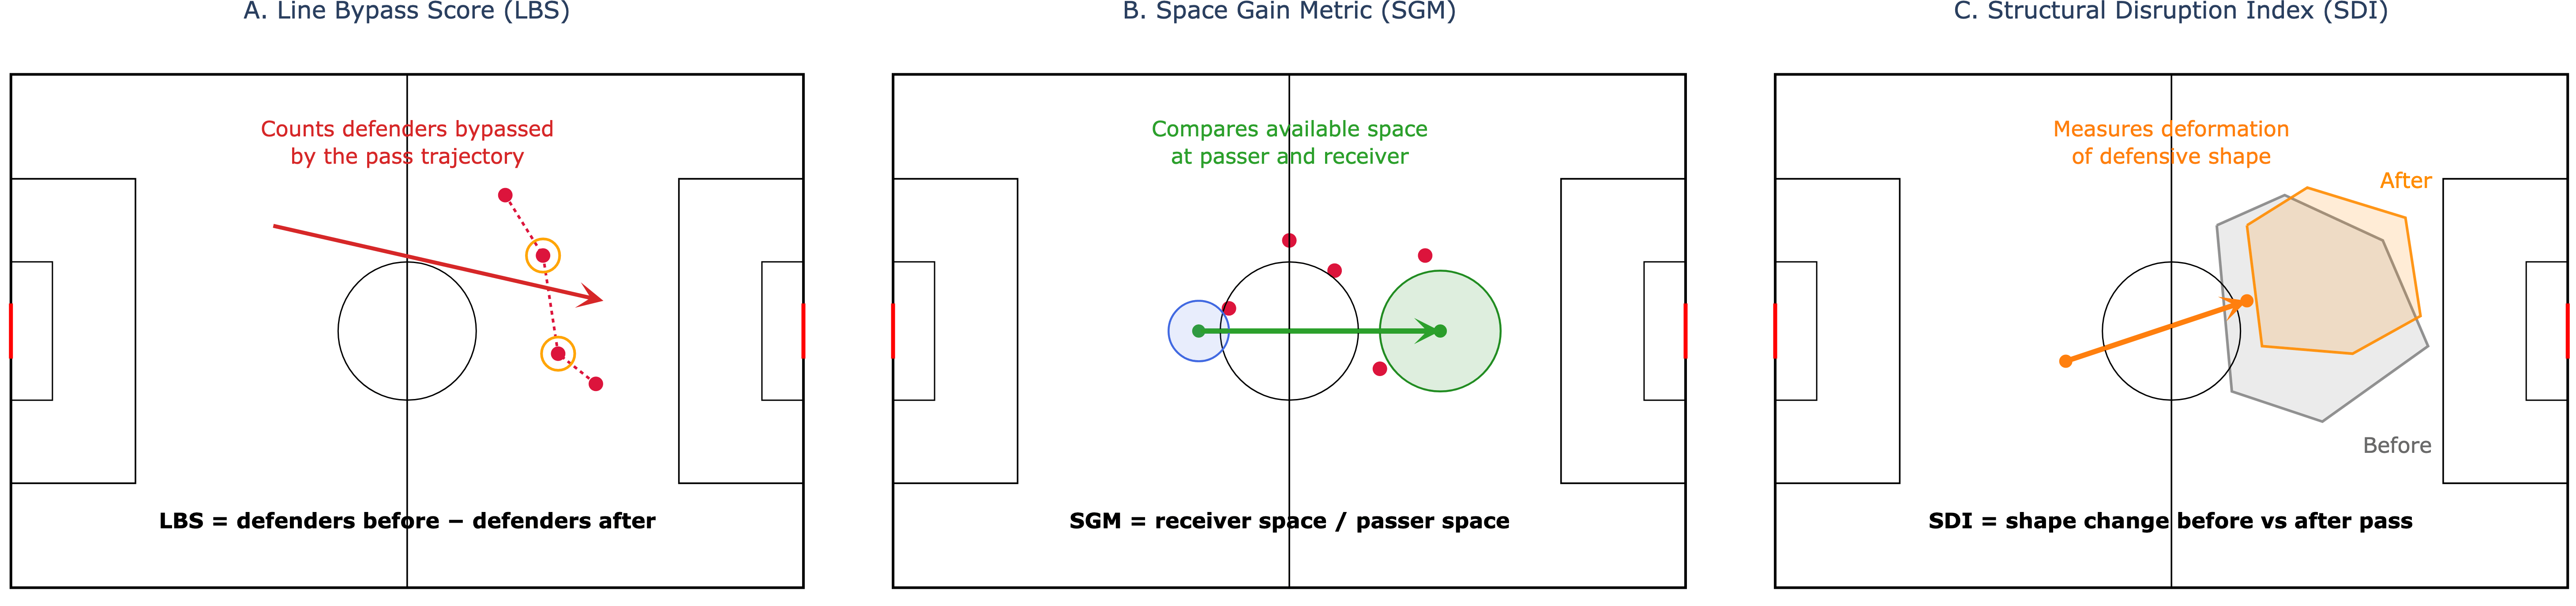
Figure 1: Quantifying structural disruption through Line Bypass, Space Gain, and Shape Deformation.
These three metrics are then combined, with equal weighting, to form the overall Tactical Impact Value (TIV). A higher TIV signifies a pass with a stronger structural impact on the opponent’s defense. Our empirical results from the 2022 FIFA World Cup dataset show a strong monotonic relationship between TIV and territorial progression: the higher the TIV of a pass, the significantly more likely it is to lead to entries into the final third and, crucially, into the penalty box. This means that passes that actively reshape the defensive organization are the ones that drive attacking sequences forward, even if they don’t directly lead to a shot.
The Four Archetypes of Passing: Every Pass Tells a Story
Not every pass is intended to be an “effective” ball, and understanding this diversity is key to tactical analysis. Through unsupervised machine learning (specifically, K-means clustering) applied to our structural metrics, we identified four distinct archetypes of passes that teams utilise:
1. Circulatory Passes (34.43% of all passes): These passes are the rhythm drivers of possession-based football. They occur in the defensive third and function as control passes, helping to maintain possession and keep shape intact. Their TIV (often negative) indicates minimal structural disruption. Think of them as the sequencer of the system, keeping the machine running smoothly, sustaining the rhythm, and waiting for a gap in the defensive block to open up.
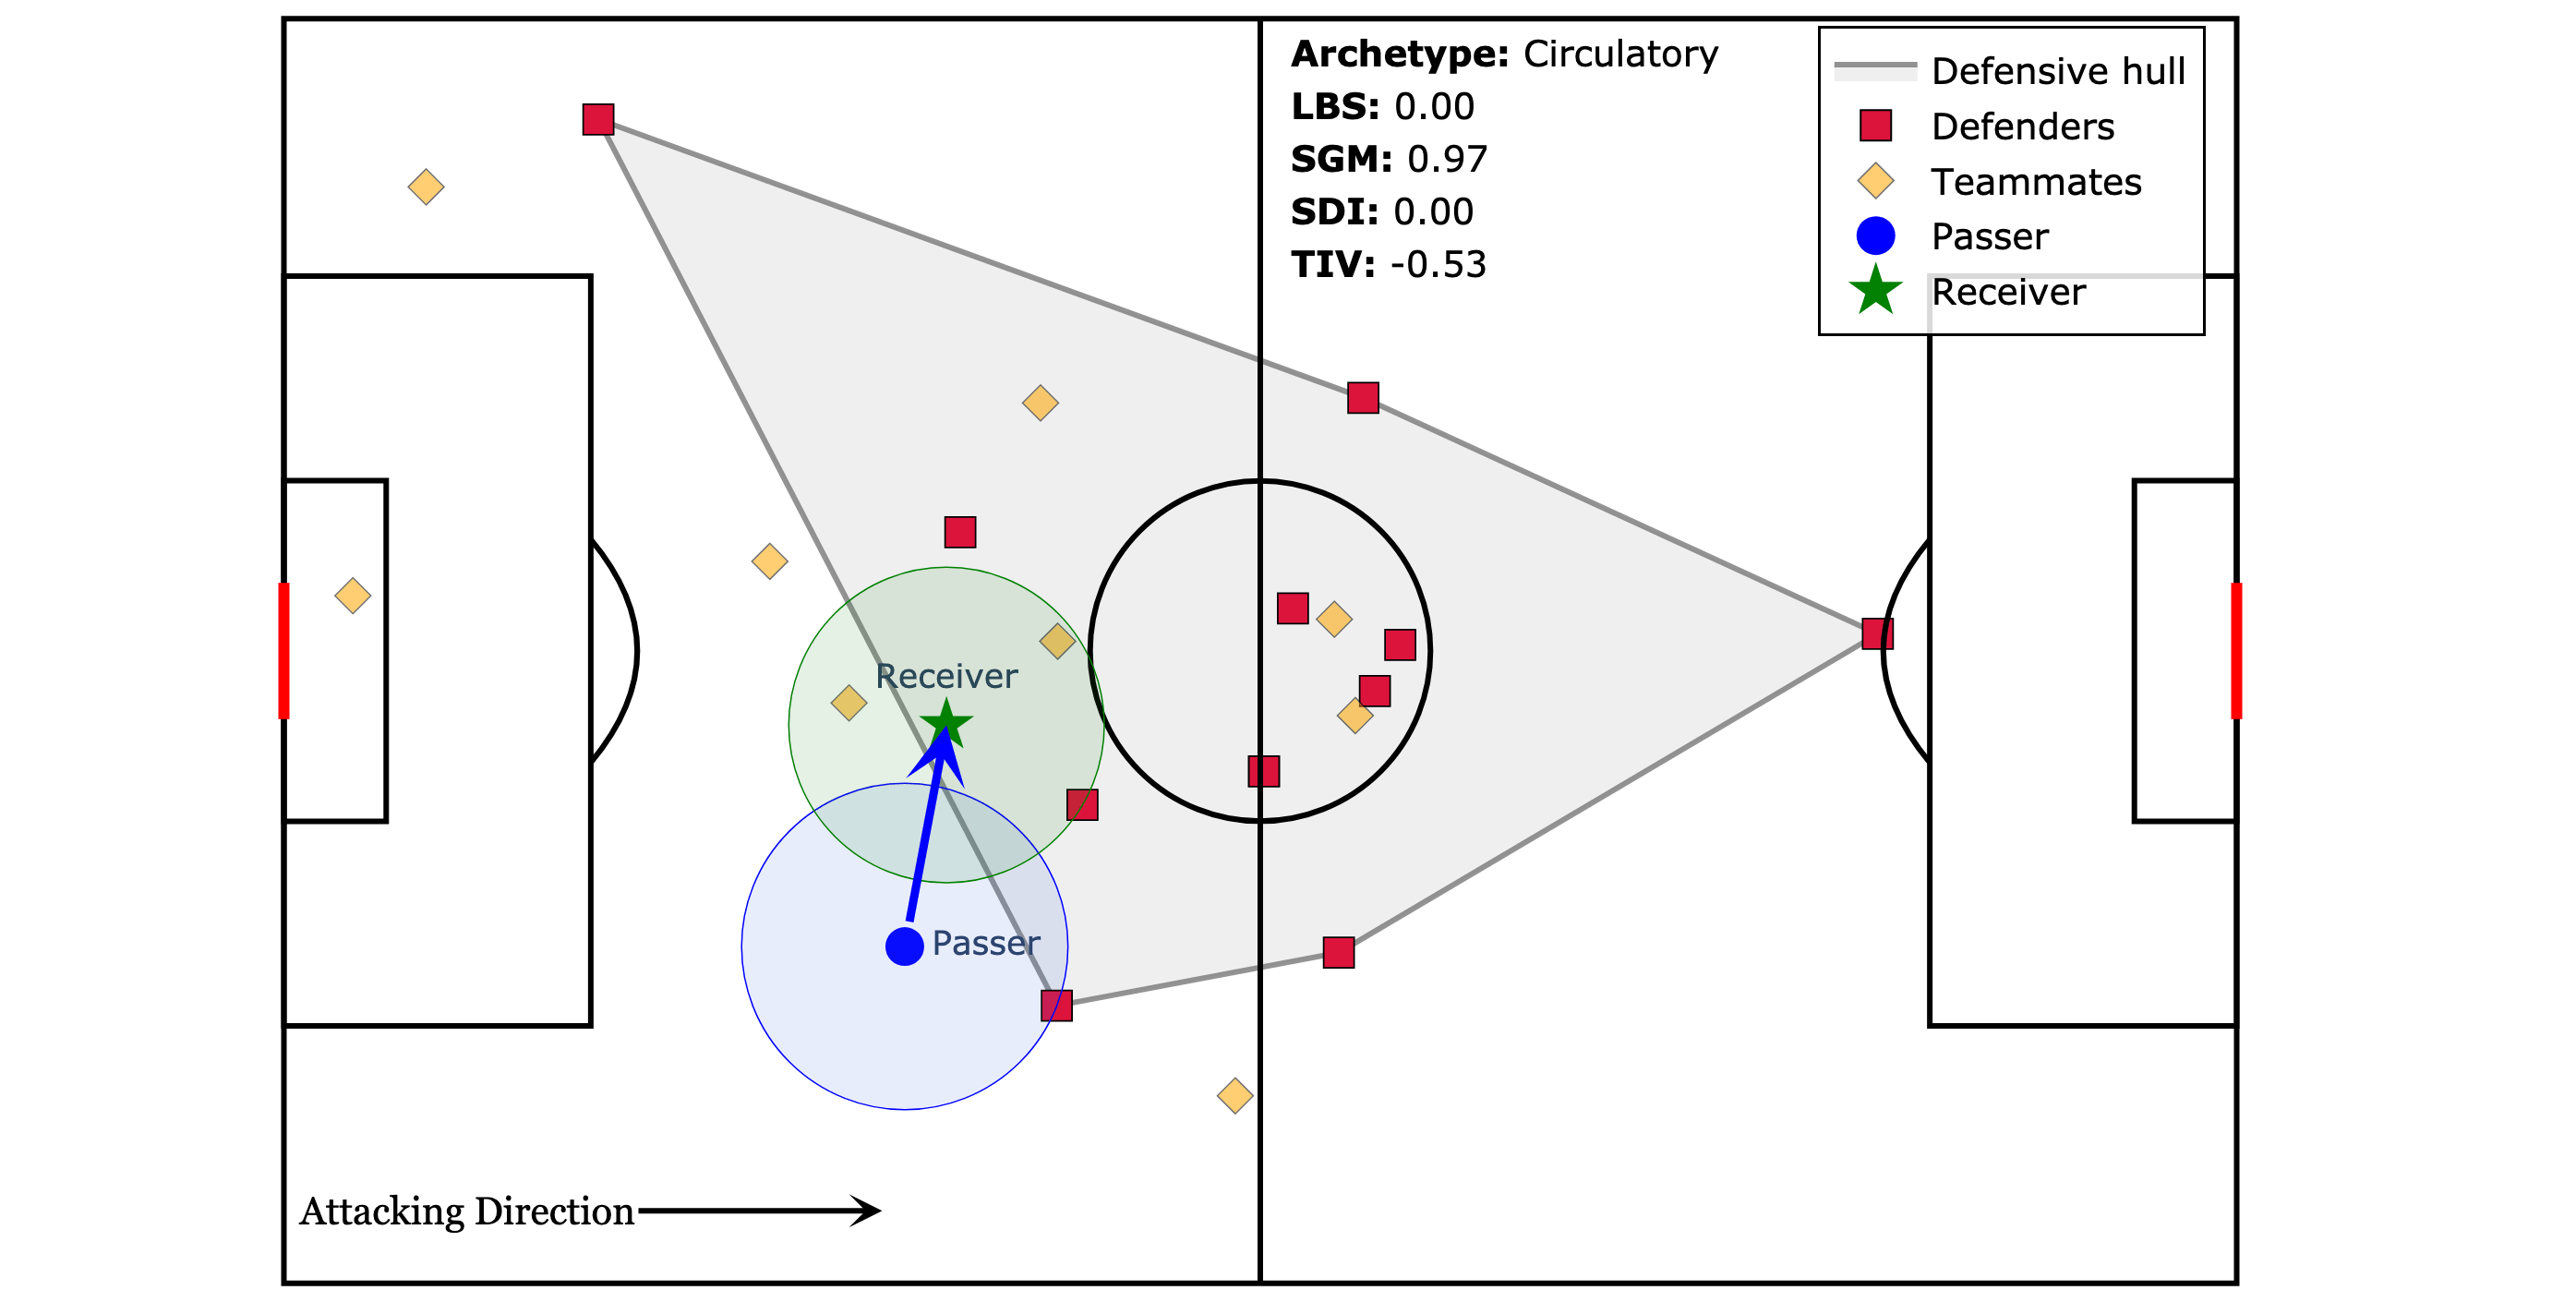
Figure 2: Structural Analysis of a Circulatory Pass. High SGM but zero Line Bypass, illustrating a stabilizing action rather than a disruptive one.
2. Destabilising Passes (31.25%): These are the subtle disruptors. They don’t necessarily break a defensive line outright, but they create small, positional imbalances in the defensive structure. They might shift a defender a few yards, opening up a tiny space for the next play. They have a modest positive TIV, indicating a measurable but not overwhelming structural effect.
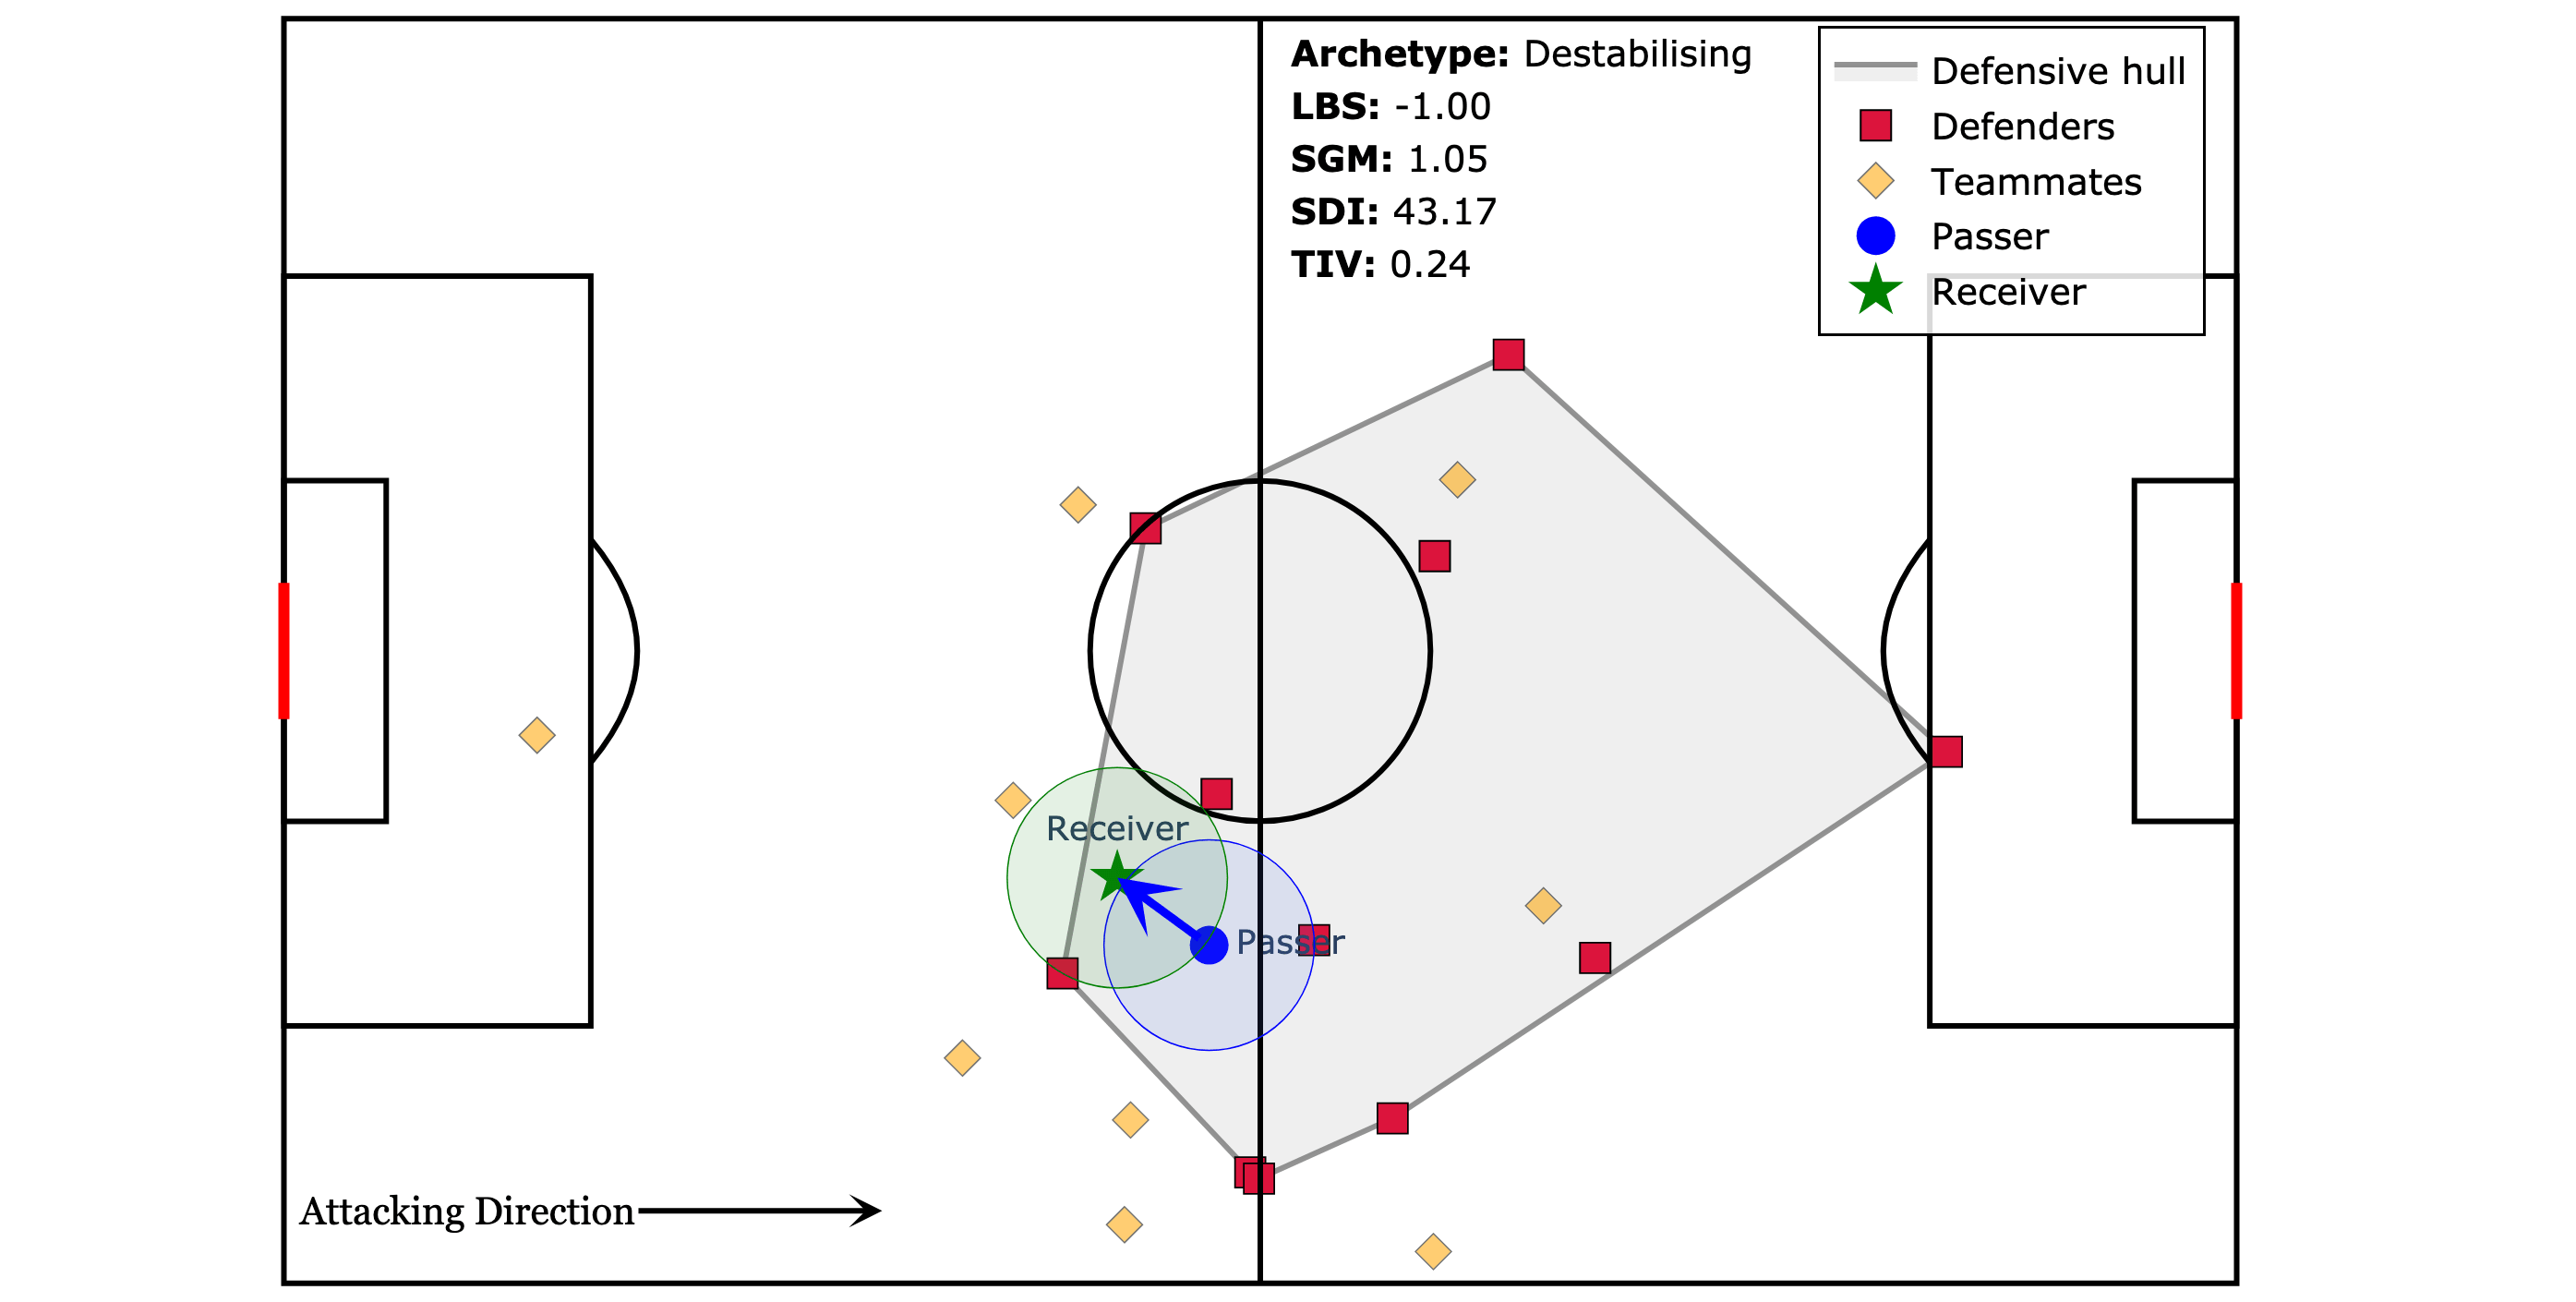
Figure 3: The Destabilising Archetype. A pass that forces the defensive shape to stretch and deform (High SDI) creating structural instability even without bypassing multiple lines.
3. Line-breaking Passes (18.28%): These are the killer passes that break the defense. They penetrate defensive layers, effectively bypassing multiple defenders positioned between the passer and the goal. These passes generally show the highest TIV values and are significantly linked with higher probabilities of leading to shots and goals, as they directly destabilise the opponent’s defensive shape and create immediate danger.
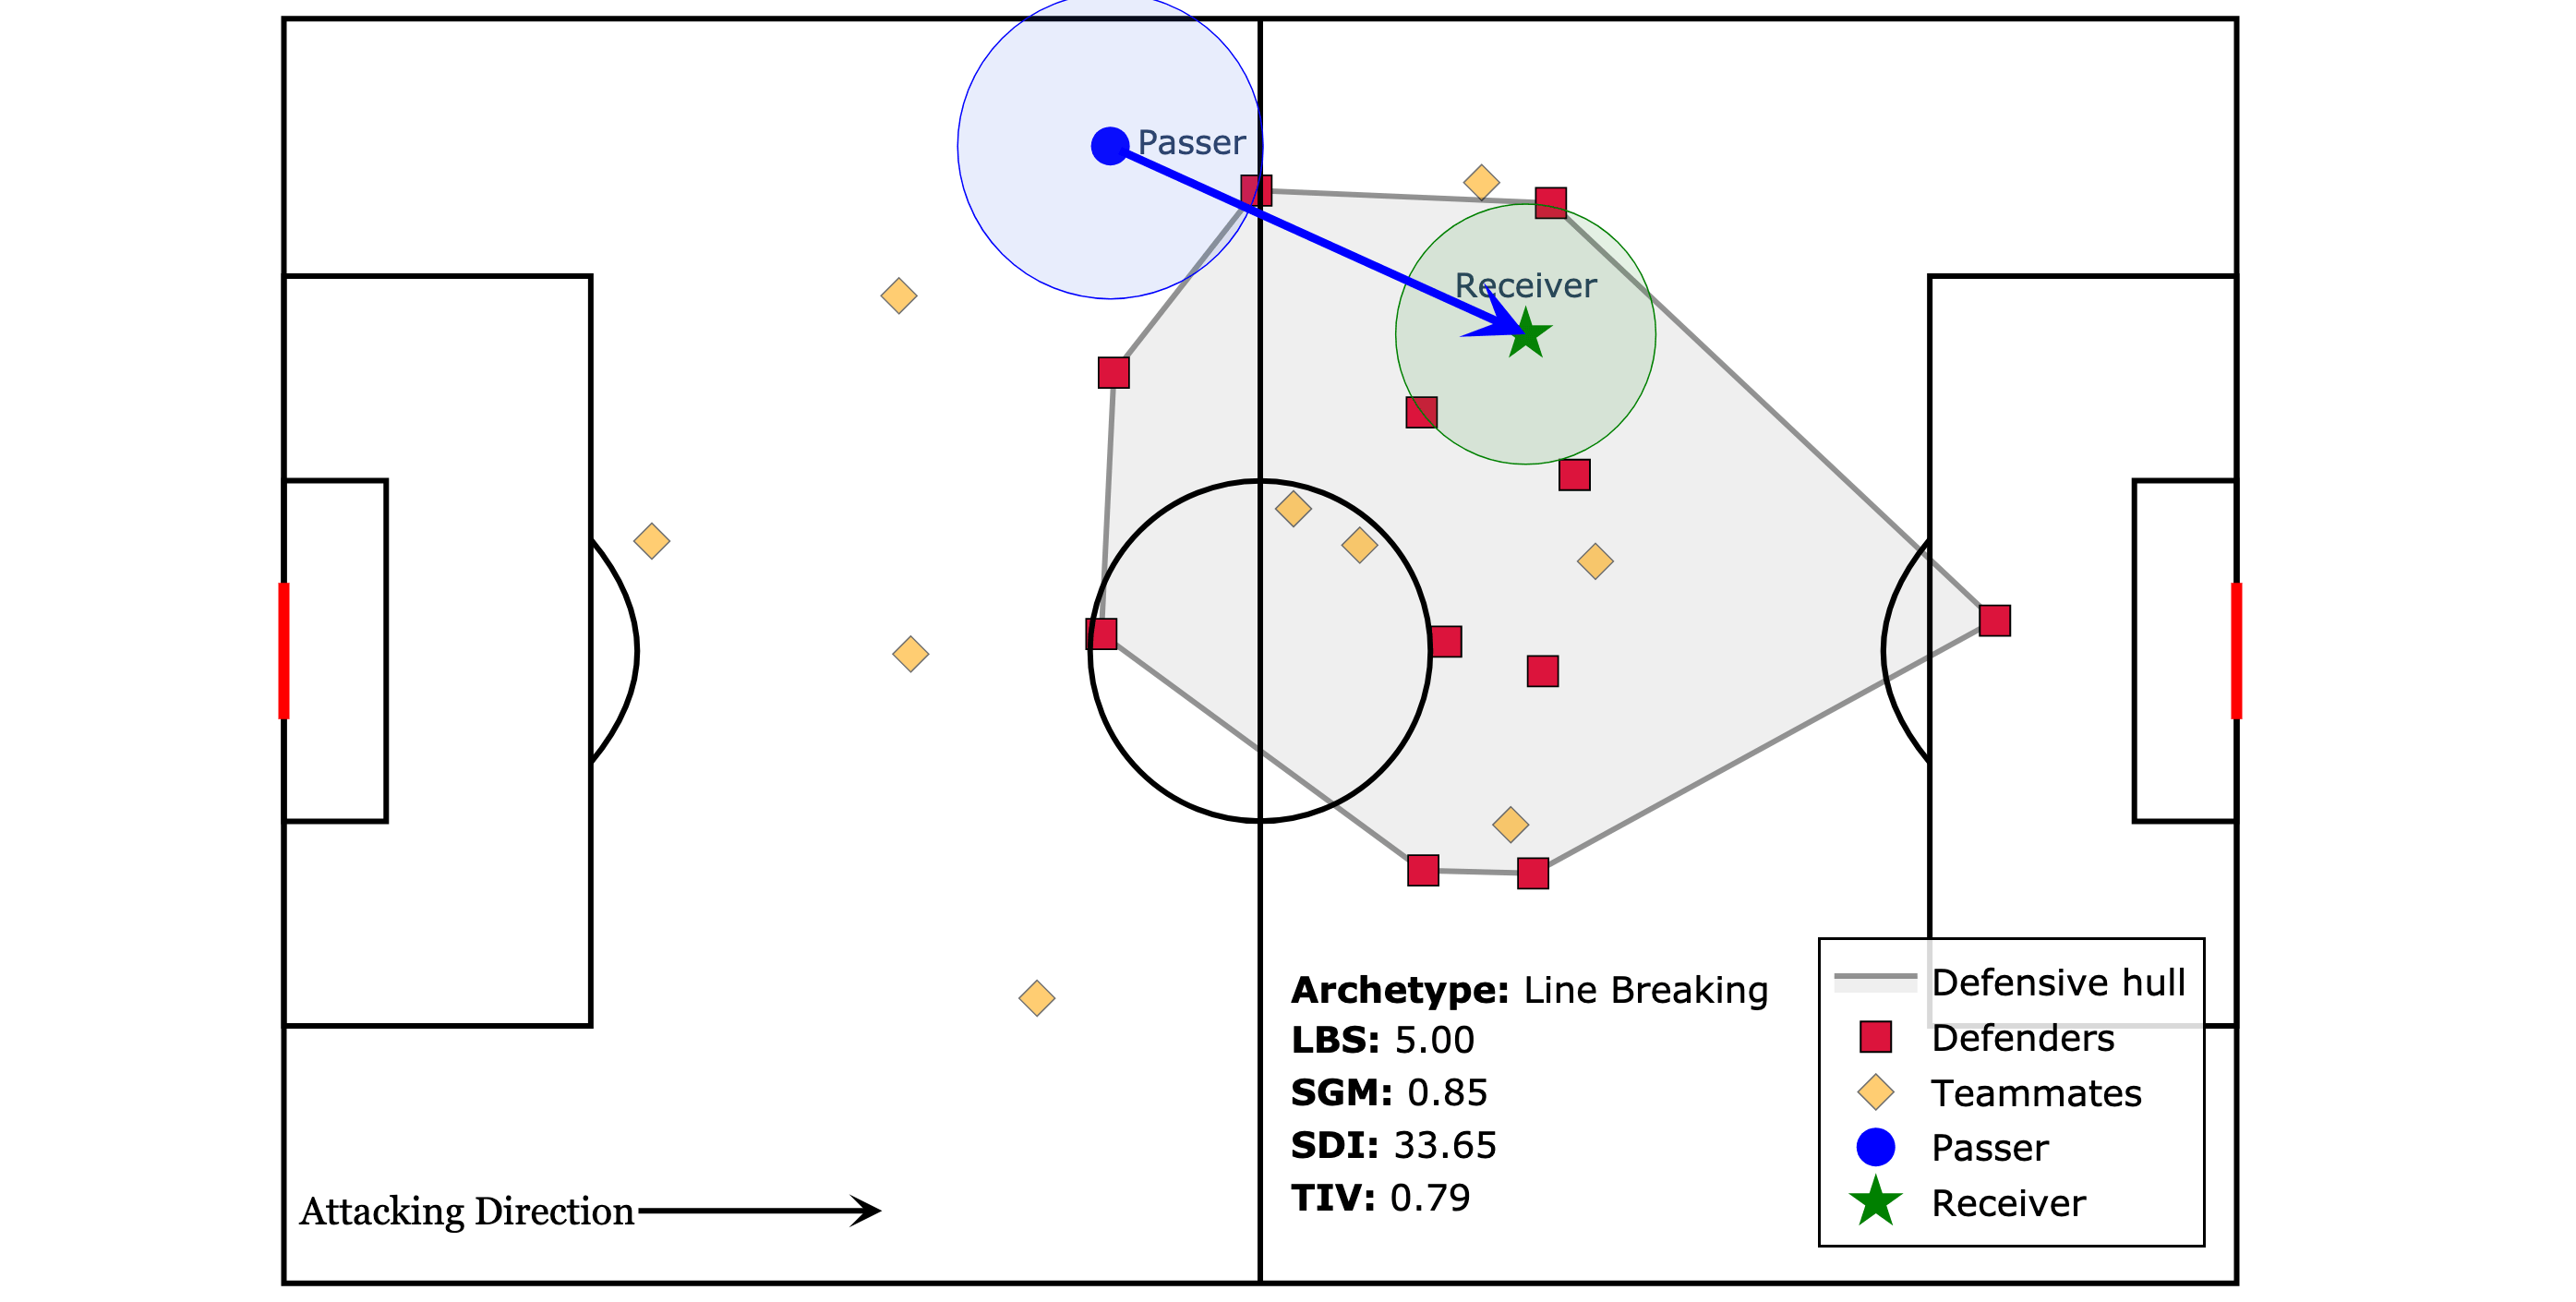
Figure 4: Line-breaking passes that penetrate defensive layers, bypass multiple defenders, and create immediate attacking danger with high TIV values linked to shots and goals.
4. Space-expanding Passes (16.04%): These passes are all about exploiting and creating space. They advance the ball into newly created attacking space, often exploiting gaps between defensive zones or stretching the opponent horizontally. While their TIV can vary, they show a high probability of leading to box entries as they open up dangerous areas for subsequent attacks.

Figure 5: Space-expanding passes that exploit and create space by stretching or opening defensive gaps, often leading to attacking progression and box entries.
World Cup 2022: Who Were the Structural Masters and What Defined Their Style?
We tested this framework on all 64 matches of the 2022 FIFA World Cup and found some interesting patterns in team behaviour. Each team has its own ‘structural signature’, a distinct mix of passing styles and where its key passes happen. Let’s look at some examples.
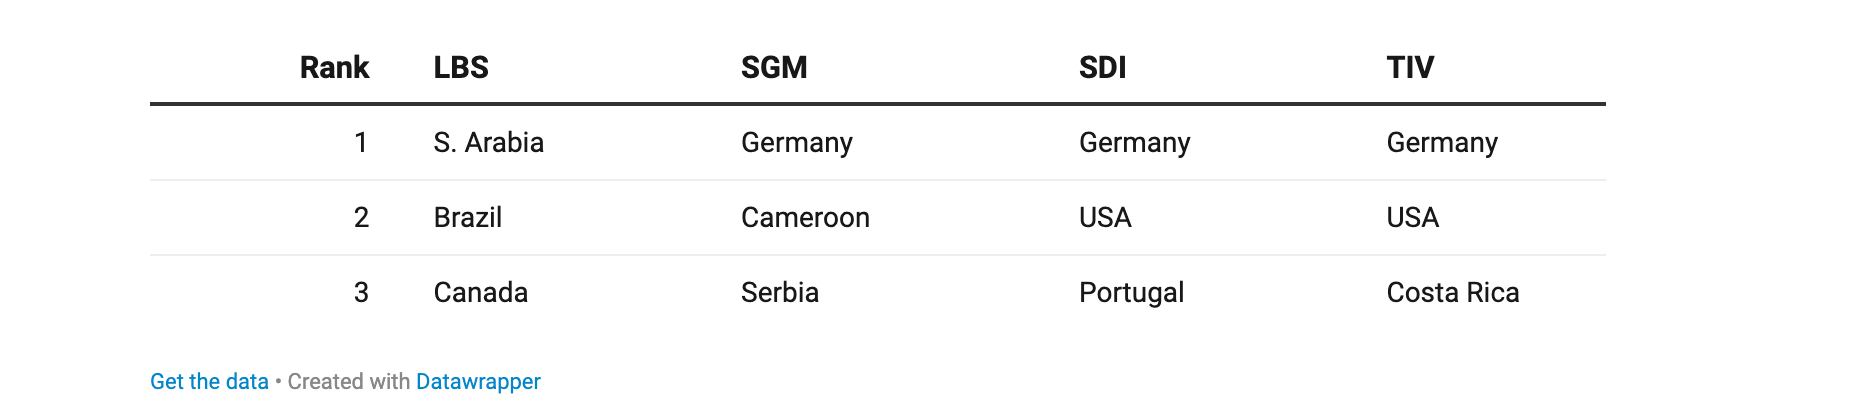
Table 1: Top three teams in the 2022 FIFA World Cup ranked by mean structural passing metrics: Line Bypass Score (LBS), Space Gain Metric (SGM), Structural Disruption Index (SDI), and Tactical Impact Value (TIV). Rankings are based on average values across all passes for each team.
The table highlights distinct structural profiles across teams, with Germany emerging as the most consistently dominant side, ranking first in SGM, SDI, and TIV, indicating a strong ability to both generate space and disrupt defensive organisation through passing. In contrast, Saudi Arabia leads in LBS, suggesting a more direct tendency to bypass defensive lines, albeit without matching the broader structural influence captured by TIV. Teams such as the United States and Portugal appear prominently in SDI and TIV rankings, reflecting balanced contributions across disruption and progression, while Brazil and Canada feature in LBS, pointing toward line-breaking capacity without necessarily translating into overall structural impact. Overall, the results reinforce that while individual structural components capture different aspects of progression, TIV provides a more holistic view, favouring teams that combine line-breaking, space creation, and disruption into cohesive attacking sequences. After this, we’ve categorised teams into four tactical “neighbourhoods” based on their dominant structural passing styles, visualised in our “Structural Style Map”:
Destabilising Progression: 🇺🇸USA, 🇨🇷Costa Rica
Circulatory Destabilisation: 🇯🇵Japan, 🇺🇾Uruguay
Space Expansion: 🇶🇦Qatar, 🇮🇷Iran
Direct Progression: 🇷🇸Serbia, 🇸🇳Senegal
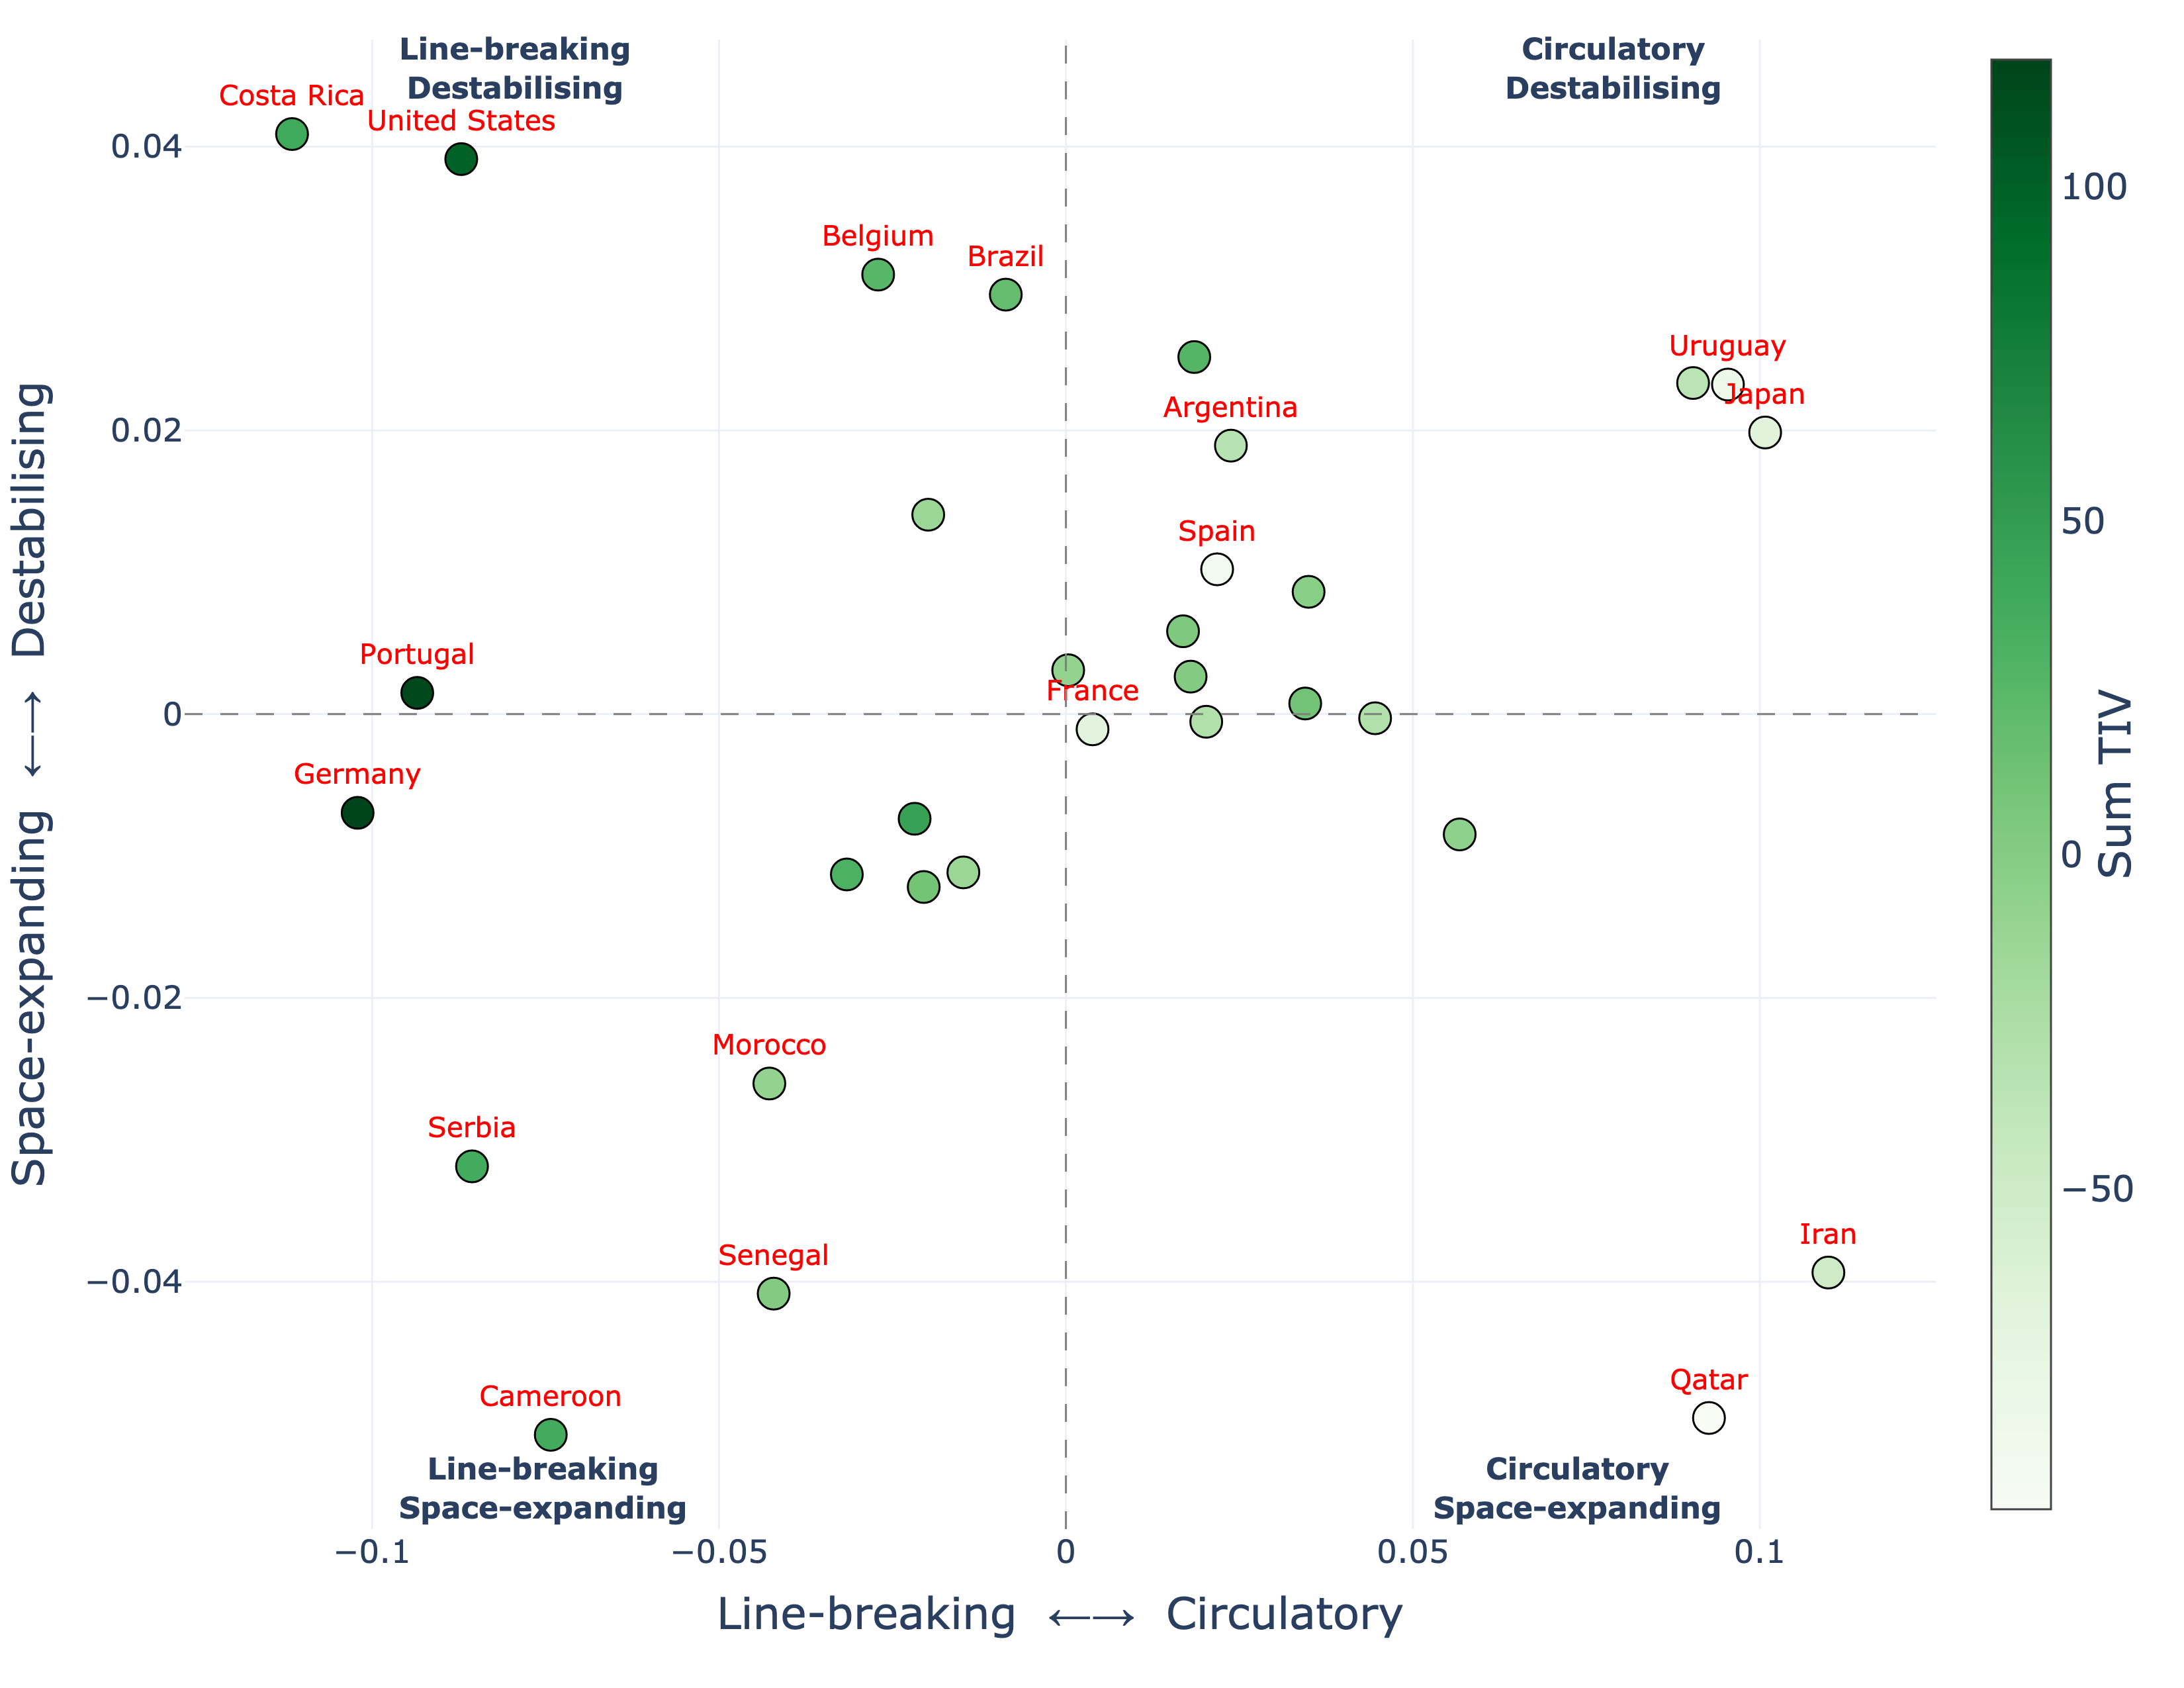
Figure 6: The Structural Style Map. Illustration of the 2022 World Cup teams based on their passing archetypes.
This style map is more than just a classification; it reveals that there isn’t a single “right” way to play. Teams use different structures to move the ball forward and exploit defences, and the right solution comes in different ways. For example, teams using more progressive structures generally created more attacks (more shots and box entries) while some balanced teams still achieved similar attacking results. Clearly, this underlines the complexity and adaptability of practical football.
Where the Impact Happens: Mapping TIV
Beyond what kind of passes teams tend to make, where they make them is equally crucial. Our analysis of the spatial distribution of TIV revealed interesting patterns:
•Pass Origin Hotspots: High-TIV passes frequently originate in deeper and wider areas of the defensive half. Zones near the defensive flanks and the edges of the defensive third often show relatively high average TIV values. This is where defenders or deep midfielders initiate progressive passes, bypassing the first pressing line or shifting the defensive block laterally and causing structural changes.
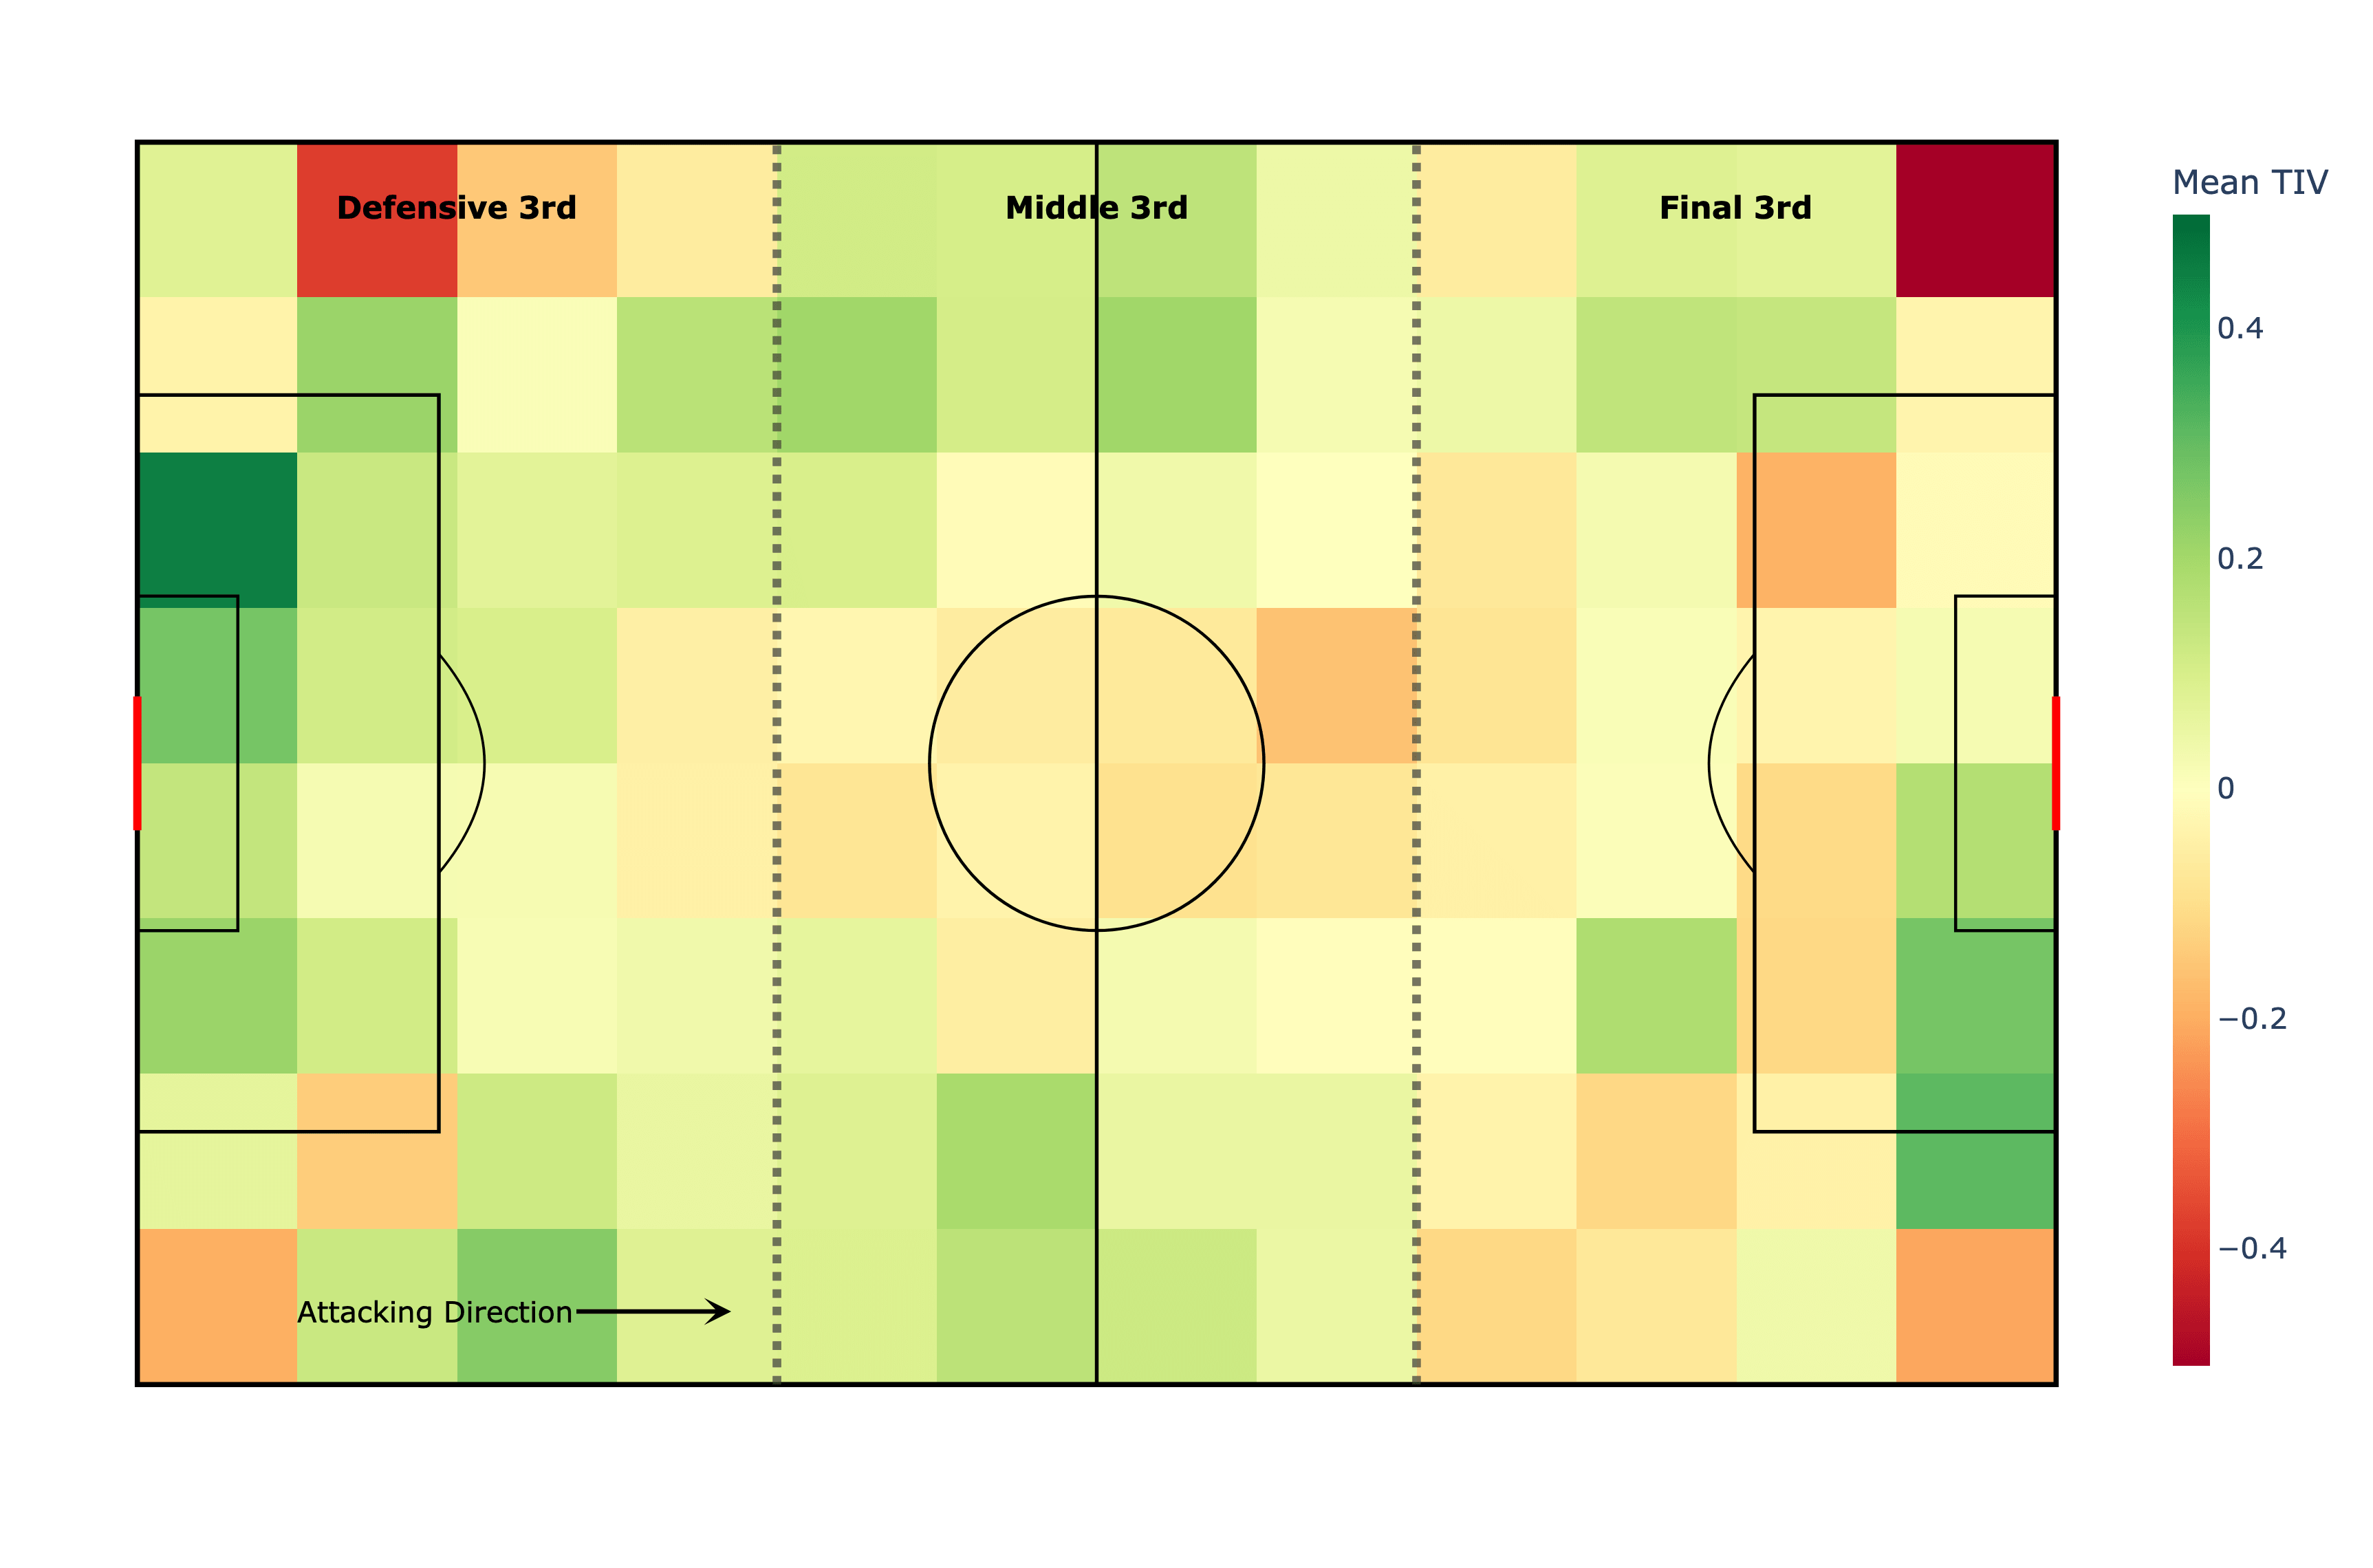
Figure 7: Pass Origin Hotspots, Defensive 3rd, Middle 3rd, Final 3rd map.
•Pass Destination Hotspots: On the other hand, high TIV values appear more in advanced areas, particularly in wide channels and near the final third corners. These are the locations where passes either successfully break defensive lines or move the ball into newly created attacking space. These high values suggest that moving the ball into wide areas stretches the defence and makes it less compact.
Interestingly, the central areas of the middle third often show lower TIV values, both for pass origins and receiving areas. This reflects how teams retain possession in these areas to maintain control instead of attacking the defence directly. It suggests that central midfield is mostly about controlling tempo and possession, while teams create real attacking danger from deeper or wider areas, ending in advanced wide positions.
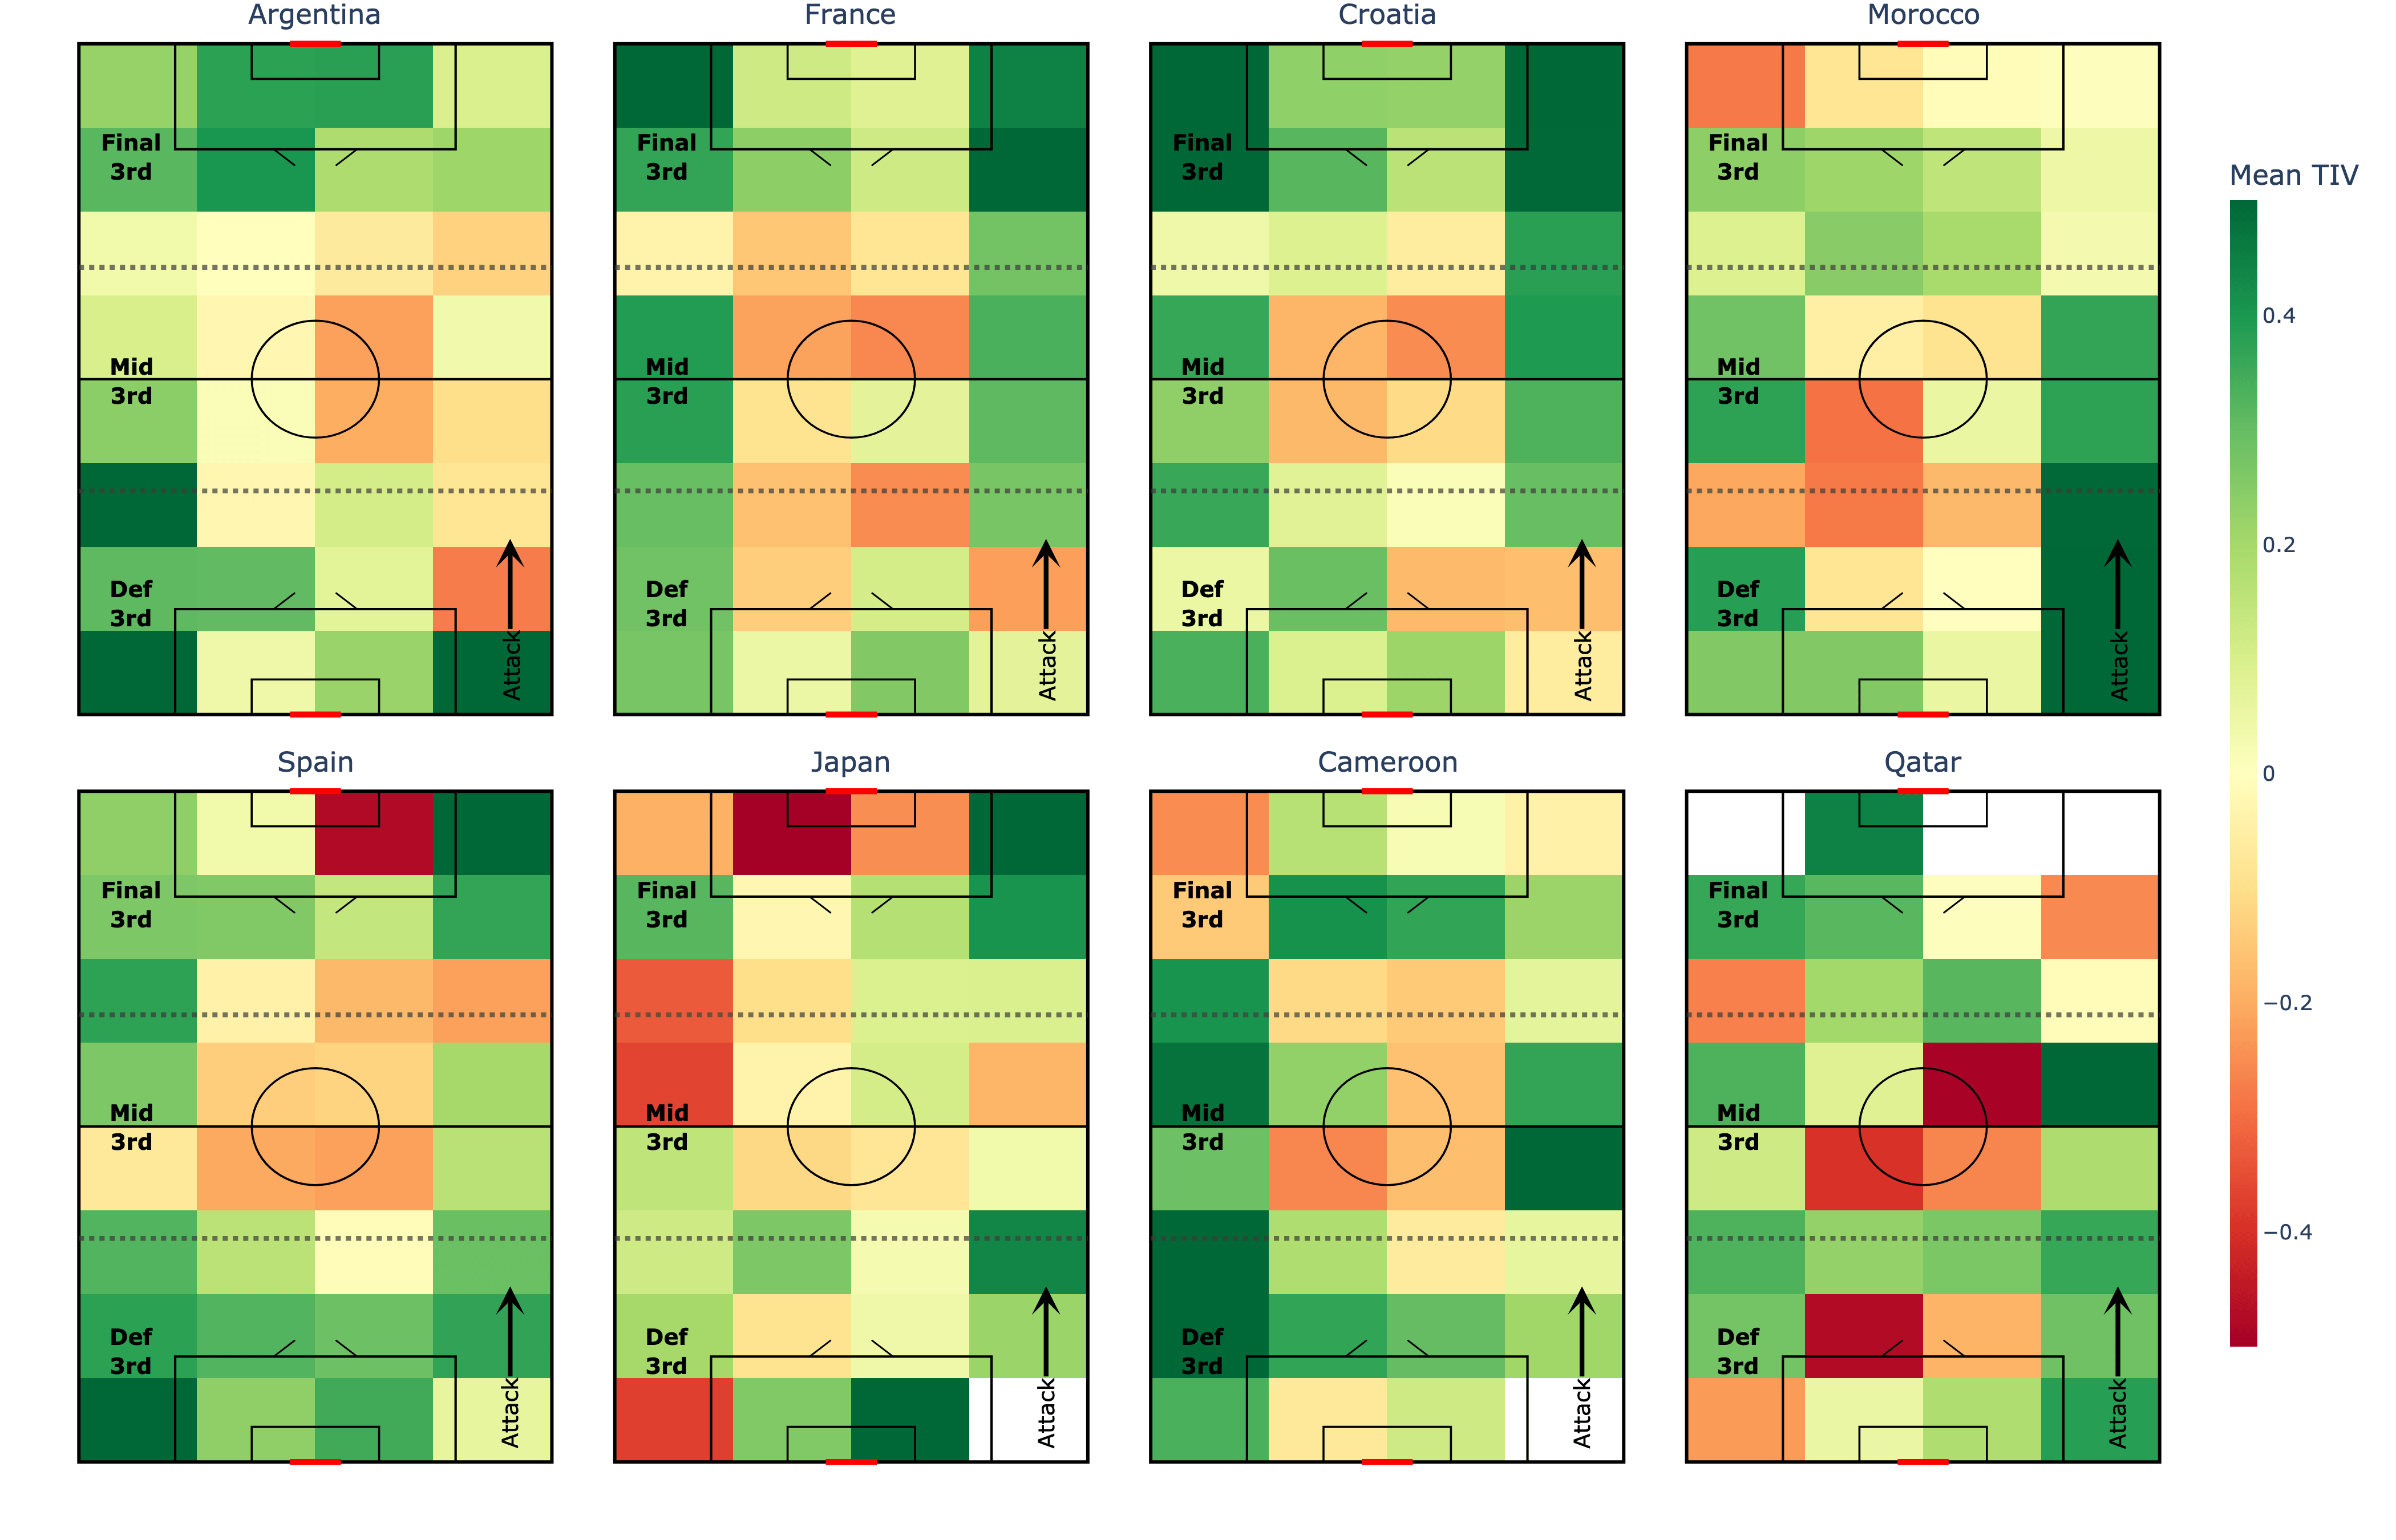
Figure 8: Team-level destination maps of mean TIV showing where passes create the highest structural impact across the pitch for selected teams.
The figure above presents team-level destination maps of mean Tactical Impact Value (TIV) across the pitch, illustrating where passes generate the greatest structural impact for 8 selected teams. Each grid cell represents the average TIV of passes ending in that zone, providing a spatial view of how teams translate possession into structurally meaningful progression. Rather than focusing on pass origin or frequency, these maps emphasise where impact is realised, highlighting the zones in which teams most effectively disrupt defensive organisation and advance attacking sequences. This perspective allows for a comparative understanding of attacking tendencies, revealing whether teams concentrate their structural influence in wide areas, central corridors, or advanced zones close to the penalty area.
🇦🇷Argentina: The eventual champions showed a remarkable ability to generate high-TIV passes concentrated in advanced central areas of the final third. This reflects their tendency to advance the ball into tight, dangerous pockets between defensive lines, where their creative players (read: Messi) could receive it and create danger. Their impact usually came from playing sharp passes into tight, crowded spaces.
🇫🇷France: The finalists displayed a similar, but slightly wider, pattern. Their “Damage Map” showed high TIV distributed across both central and right attacking channels. This aligns perfectly with their emphasis on rapid transitions and exploiting wide areas with players like Mbappé and Dembélé, stretching defences horizontally before delivering the final action.
🇭🇷Croatia: A masterclass in possession-oriented build-up. Their most impactful passes often originated from deeper build-up zones, particularly in the defensive third and along wide areas. This highlights how their deep-lying midfielders (Modrić, Brozović, Kovačić) meticulously initiated progressive passes to destabilise opposing defensive blocks from deep, patiently creating openings.
🇲🇦Morocco: The surprise team of the tournament showed a clear bias towards wide areas, with most of their dangerous passes coming down the flanks. It matches their direct, transition-heavy style, getting the ball wide quickly, avoiding the packed midfield, and breaking forward fast.
🇪🇸Spain: Even within their renowned possession-based style, Spain showed distinctive patterns, with strong TIV values in the wide attacking zones of the final third. This suggests that while they dominate possession, their most structurally impactful passes are often aimed at creating width and stretching the opponent in advanced areas.
🇶🇦Qatar: The host nation appeared in the space expansion region of our style map, indicating a higher reliance on passes that move the ball into open space, often at the expense of direct defensive destabilisation. Their map suggests a tactical approach focused on finding gaps rather than forcing them.
🇷🇸Serbia and 🇸🇳Senegal: These teams were characterised by a direct progression style, emphasising vertical advancement with comparatively limited structural manipulation. Their passes aimed to move the ball forward quickly, often bypassing intricate build-up play.
Explore the Data Yourself: Dive into the Dashboard
Our goal was not simply to write a paper. We wanted to give fans, analysts, and coaches a way to explore these insights themselves. That’s why we built an interactive Structural Analysis Dashboard. You can look at the data, see TIV heatmaps, compare teams, and understand the tactical details of the 2022 World Cup. It’s a simple way to break down the game in more detail.
📐📊Explore the interactive Structural Analysis Dashboard → here.
We are currently finalising public access. In the meantime, you are welcome to explore and test the tool, share feedback, and help us improve it.
What’s Next? The Player’s Touch
The team-level structural analysis is just the beginning. Teams determine the overall strategy, but it’s the players who bring it to life through their decisions and passing choices that shape the flow of the game. In the next post, we’ll focus on the player perspective and explore questions like:
•Who are the “Line-Breaking Kings” consistently deliver the highest TIV passes?
•Which defenders are the best playmakers from deep and building play?
•Which passing duos show the strongest chemistry and help teams progress the ball together?
Stay tuned for Part 2, where we explore the individual brilliance behind the structural impact. In the meantime, we’d love to hear your thoughts in the comments: Which team’s “Structural Signature” from the 2022 World Cup surprised you the most, and why?
We’re officially back in the lab, and it feels incredibly good to be back in your inbox and sharing what we love. We’ve got a lot more coming your way very soon. Wishing you a week full of ‘line-breaking’ moments, both on and off the pitch. Cheers!
Hasan & Oktay
Photo credit: The Guardian / Tom Jenkins