- Dead Ball Analytics
- Posts
- The Tightest Premier League in Recent History
The Tightest Premier League in Recent History
How Does Our Simulator See I
Dead Ball Analytics
November 21, 2025
If the Premier League has felt unusually chaotic this season, it’s because it is. The gap between 3rd and 10th after 11 games has never been smaller since records began in the 1995-96 season. The big clubs are wobbling, the pack is suffocatingly close, and the table is shifting week to week like a kaleidoscope.
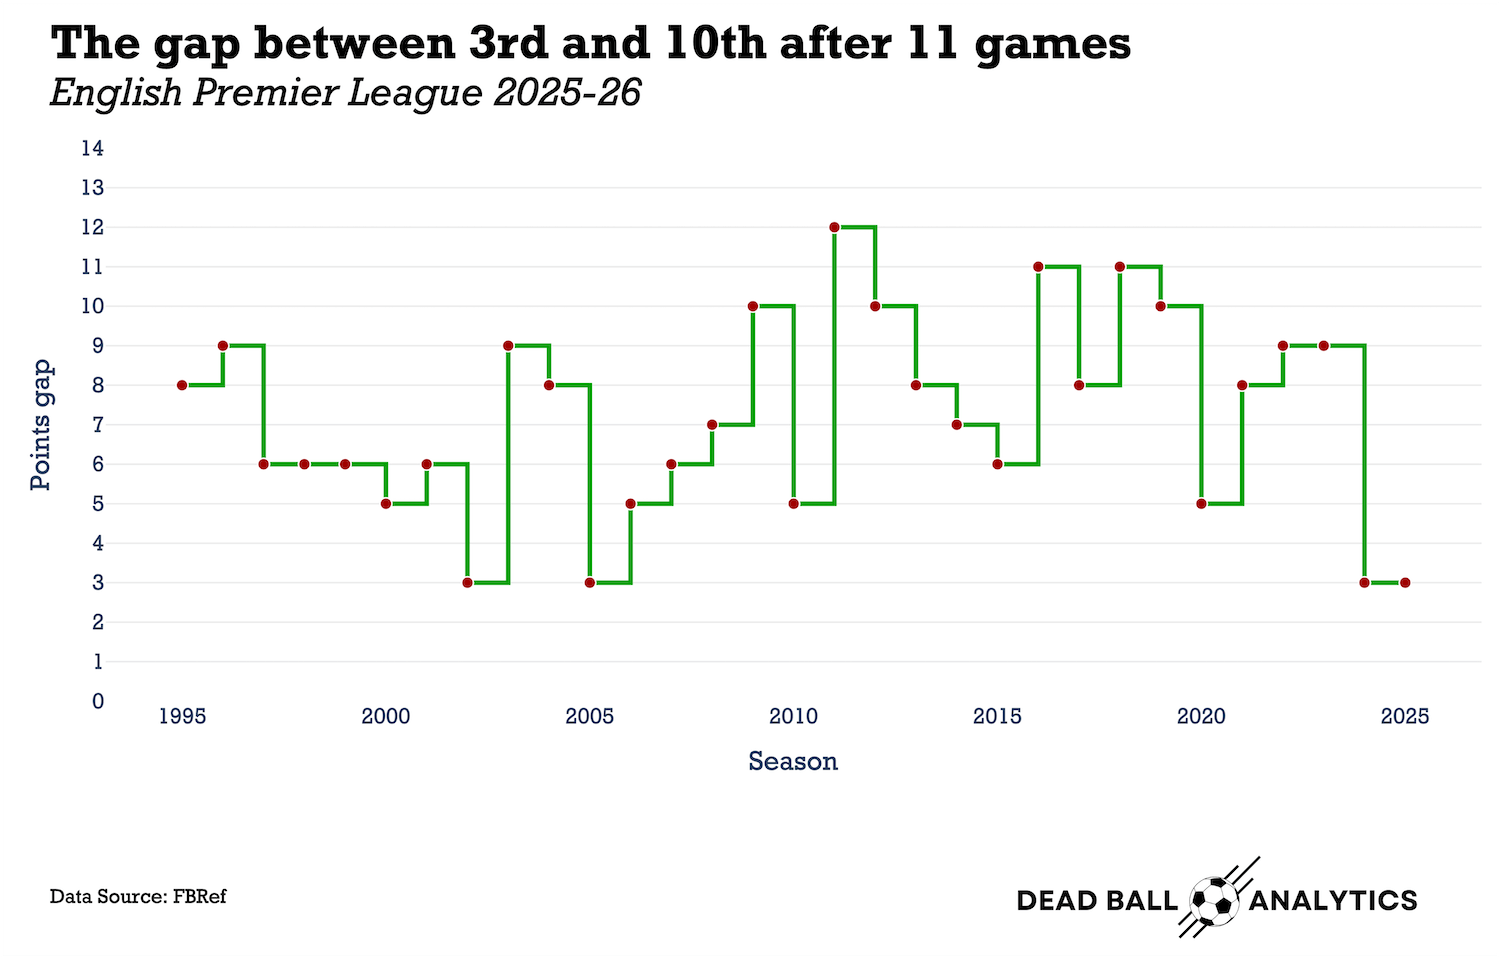
Figure 1: 3rd–10th gap after 11 games (since 1995–96)
In an era where small margins define everything (title races, European spots, survival), volatility is not noise. It’s the story. At Dead Ball Analytics , we aimed to quantify that chaos. So we turned to The Dead Ball Analytics Simulator, our match-by-match engine that plays the season forward 10,000 times, recalibrating team strength, form and match dynamics after every simulated whistle.
•If the league is historically tight, how does that tension translate into probabilities?
•How fragile are the current top-four hopes?
•And which teams are living on borrowed time?
The numbers, as always, tell a deeper story.
The Bottom Half: Where the Real Chaos Lives
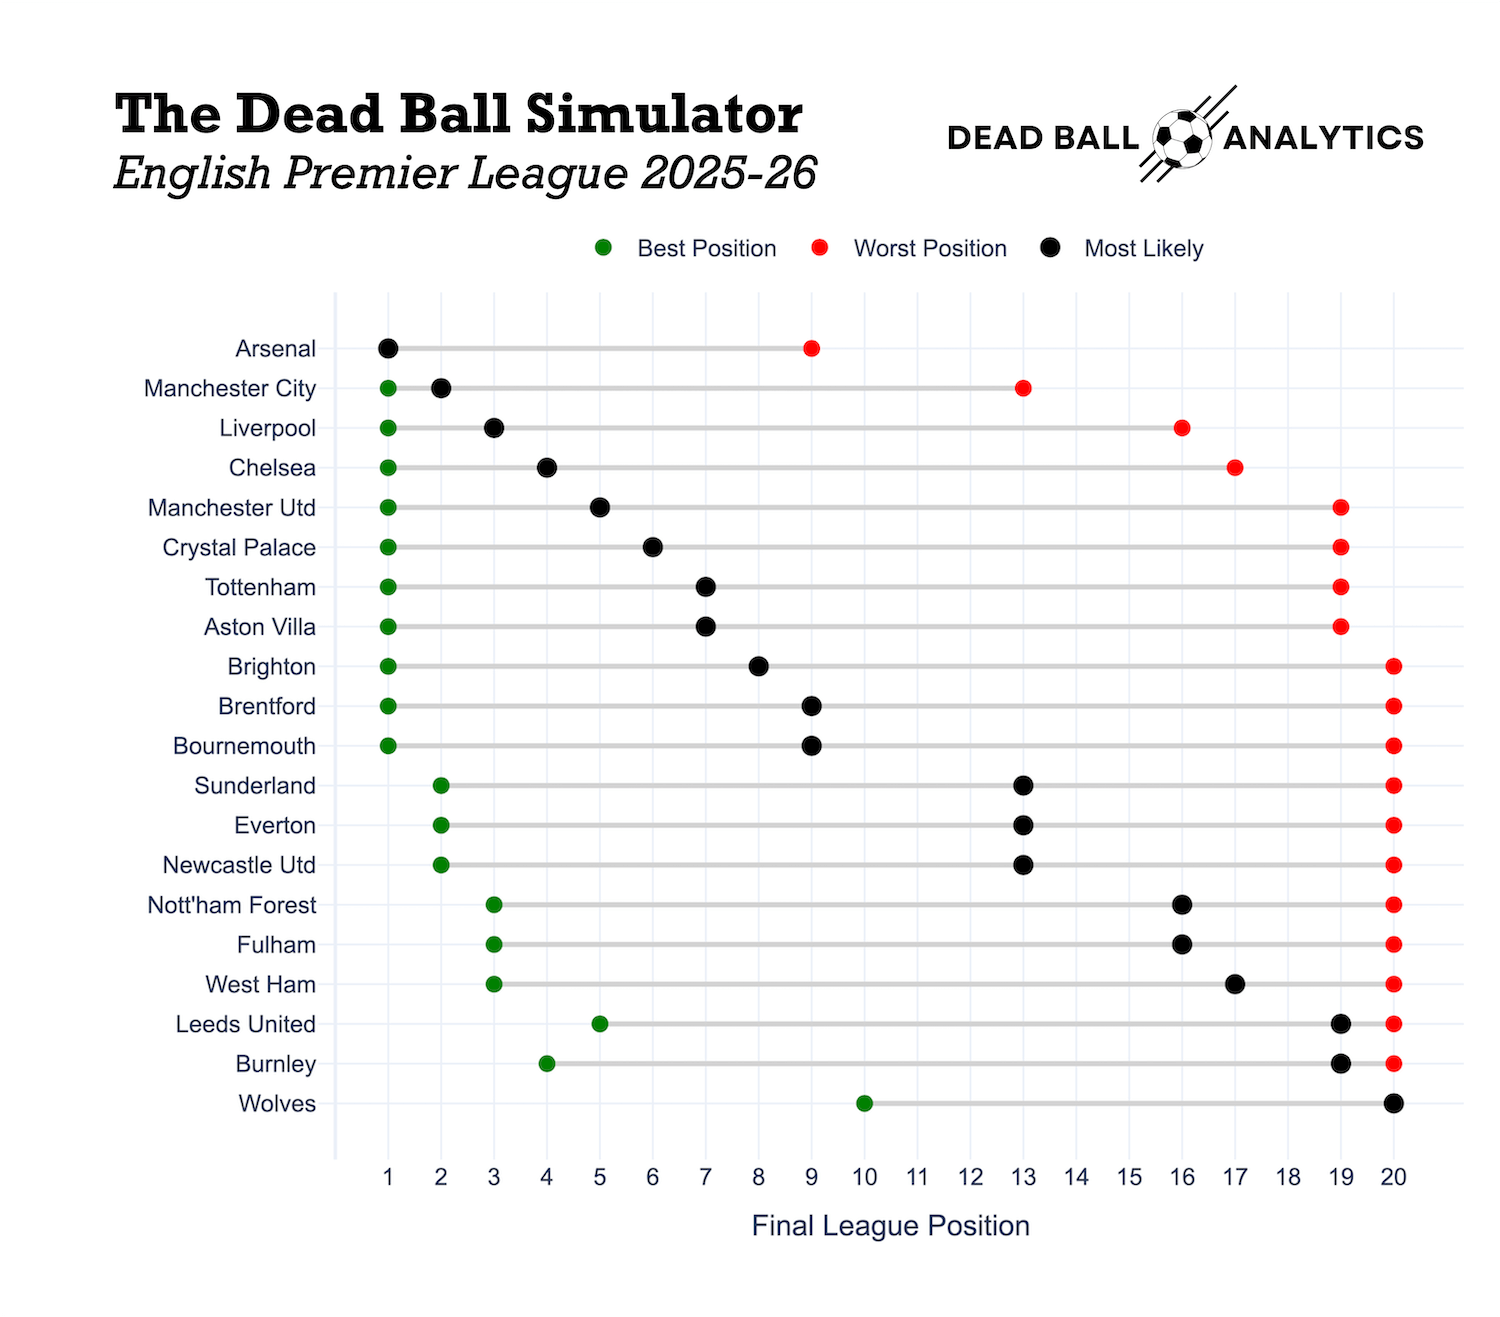
Figure 2: Best, worst, and most likely final positions for each Premier League club in the Dead Ball Simulator
While the Premier League title race draws the headlines, it’s the bottom half of The Simulator’s projections that hides the real volatility and the most intriguing storylines.
What immediately jumps out from the distribution of best, worst, and most likely outcomes is just how compressed and fragile the mid-table really is. There is a significant portion of the table, roughly from Everton down to Leeds United, a single good or bad week can swing a team’s final position by five to seven places.
Fulham, West Ham, and Leeds United: A Cluster of Instability
These three clubs, sitting around the 14th–17th range in most simulations, show some of the widest final-position ranges in the league:
Fulham can plausibly finish anywhere from lower mid-table safety to the fringes of a relegation threat.
West Ham carries a similar spread but with slightly safer most-likely outcomes.
Leeds United, perhaps the biggest wildcard, exhibit huge variance: simulations show them bouncing between relative safety and deep bottom-three danger.
This kind of distribution usually indicates inconsistency, fixture sensitivity, or a big gap between home vs. away performances and The Simulator captures that unpredictability perfectly.
Burnley & Wolves: The Uncomfortable Floor
At the very bottom, Burnley and Wolves stand out for a different reason:
Their “worst-case” outcomes are almost always pointing toward 20th.
Wolves, despite having the occasional mid-table position, still carry a heavy risk where their ranges repeatedly touch the bottom position.
Burnley shows a similar pattern: a few hopeful peaks, but a gravitational pull toward the relegation zone.
These two clubs, more than any others, show structural weakness in the simulations, their form, squad strength, and home/away profiles give them fewer pathways upward.
Everton & Newcastle United: Stability, But With Very Different Stories
Everton and Newcastle present the opposite profile:
Everton shows one of the tightest outcome bands in the entire bottom half. Their simulations keep them in a narrow window just above the danger zone rarely soaring upward, but rarely collapsing.
And beyond the numbers, there’s the narrative: this is a club still trying to reconnect with its identity of the Moyes era, searching for stability and the solidity that once defined them.Newcastle, meanwhile, sit in a similar “safe” zone, but for a very different reason. Despite playing Champions League football this season, The Simulator consistently places them far from the top four. Their most likely outcomes cluster around mid-table, a reminder of how steep the league’s competitive climb has become, and how unforgiving fixture congestion can be.
Both teams look stable, but their trajectories tell two very different stories.
🇬🇧 Premier League: The Story at the Top
If the bottom half is chaotic, the top half is something else entirely, a collision of ambition, spending power, and tactical identity. And according to The Dead Ball Analytics Simulator, the gaps between these teams are razor-thin in ways the table alone doesn’t reveal.
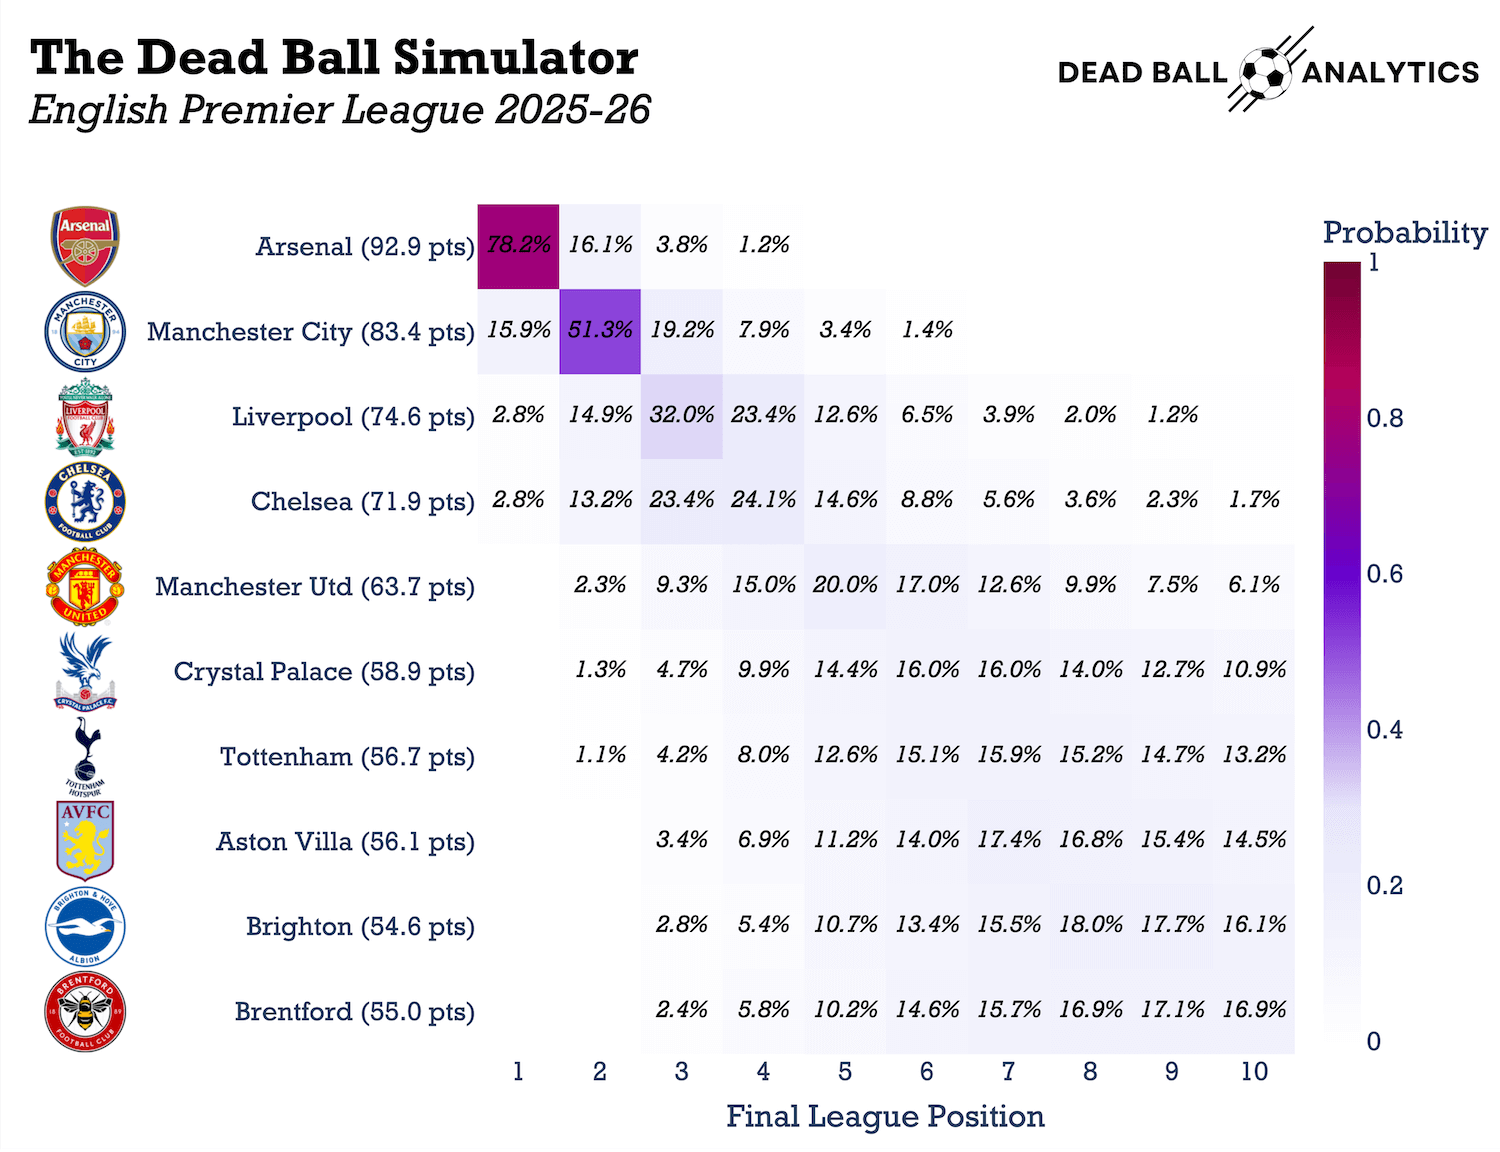
Figure 3: Top-10 finish probabilities for each Premier League team.
Arsenal: Title Favourites (92.9 pts expected)
No drama here. Arsenal dominate the simulation with a 78% chance of finishing 1st, comfortably ahead of the chasing pack. The numbers suggest a team that’s both consistent and explosive, with only a 1.2% chance of dropping outside the top four.
This is a title push backed not by hype, but by cold, repeated simulation logic.
Manchester City: Almost Inevitable
City remain City, heavy favourites to finish 2nd (51%) but still with a 15.9% chance of stealing the title, depending entirely on how often they win their head-to-heads in the simulated universe. The model sees City’s floor as incredibly high and their ceiling still within touching distance of Arsenal.
Liverpool & Chelsea: The Chaotic Middle
Here’s where the real cluster lives:
Liverpool’s probabilities scatter across positions 3 to 7, with significant mass in 4th and 5th, a team good enough for Champions League football, but inconsistent enough to slip out of it.
Chelsea look incredibly volatile: equally likely to finish 3rd (23%) or 4th (24%), but with non-negligible chances all the way down to 8th and 9th.
The simulation sees potential and danger in equal measure.
Manchester United: A Team Without Edges
Manchester United’s distribution is a plateau, spread almost evenly between 4th and 9th. No clear peak. No dominant outcome. Just pure mediocrity built into the model’s fabric.
C.Palace, Spurs, Villa: The European Football Tickets
Crystal Palace are a revelation:
A mid-table team with legitimate 5th/6th-place upside across thousands of universes.
Spurs and Villa form the expected trio: stable, competitive, rarely spectacular but always within the European conversation.
Brighton & Brentford: The Quiet Climb
Both sides are standing on the edge of something promising. Brighton hover around 6th–9th, while Brentford maintain steady probabilities around 7th–10th.
Not flashy, not disastrous, just reliably competitive.
Fight for Top 4
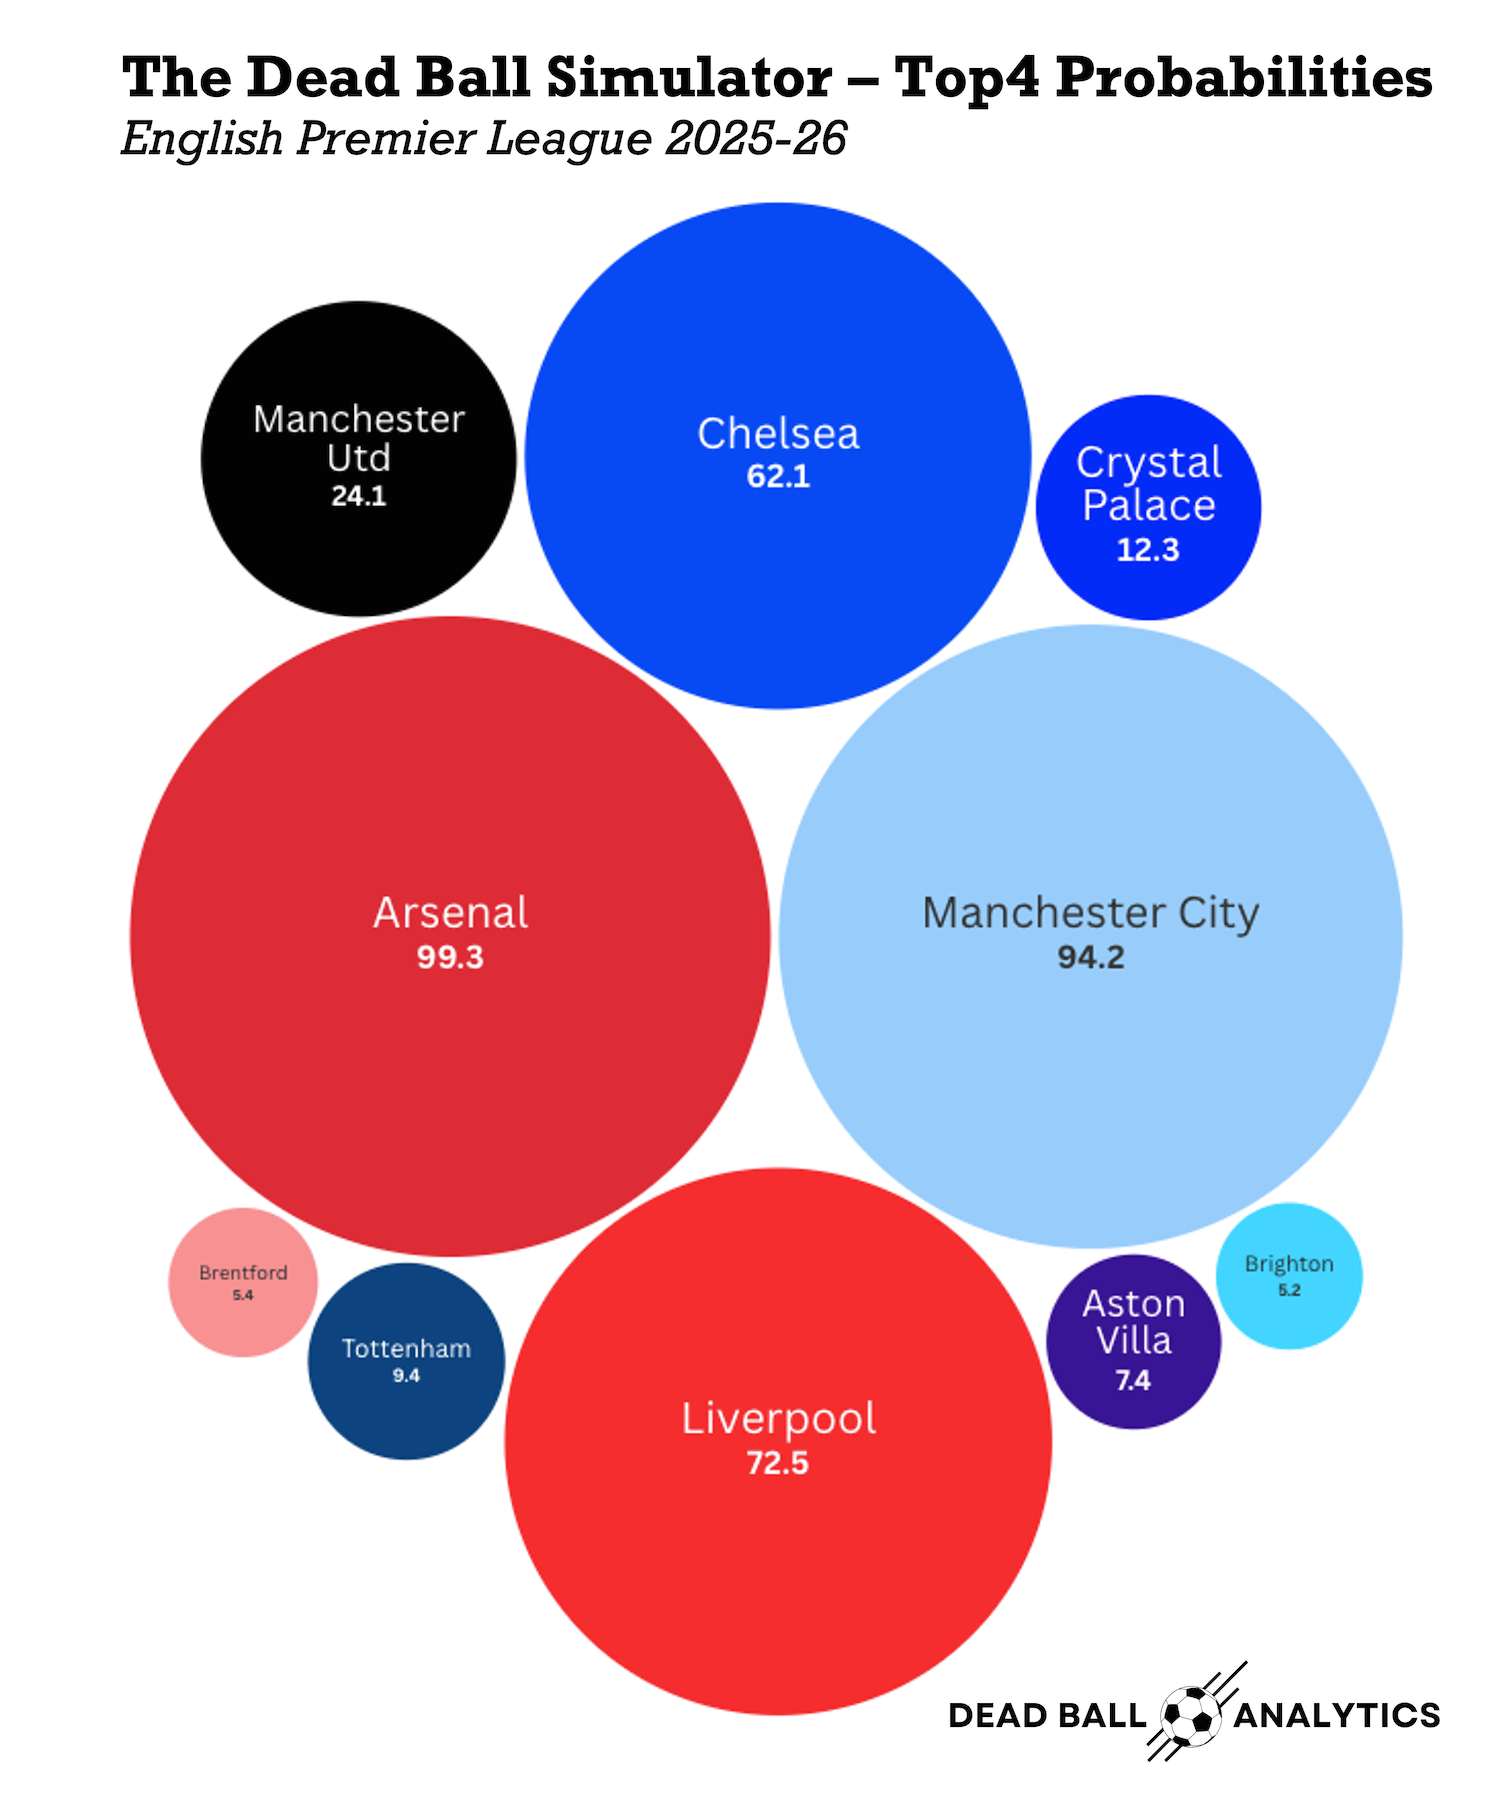
Figure 4: Simulator-estimated probabilities of finishing in the top four
At the sharp end of the table, the numbers are crystal clear. Arsenal are almost a mathematical certainty for the top four; 99.3% of our simulations have them finishing in the Champions League places. Manchester City isn’t far behind on 94.2%, which essentially locks in the title race as a two-team conversation in terms of UCL security. Behind them, things start to wobble: Liverpool still qualify in nearly three out of four universes (72.5%), but they’re not bulletproof. Chelsea sits in that fascinating middle ground at 62.1%, more likely in than out, but with enough volatility that one bad week can flip the story.
Below that, we’re firmly in long-shot territory. Manchester United still make the top four in 24.1% of runs, a puncher’s chance, but also a reflection of how much ground they need to make up. Crystal Palace, Tottenham, Aston Villa, Brentford and Brighton all live in the single-digit/low-teens band (12.3% → 5.2%), which is less “realistic objective” and more “everything breaks our way and the giants implode.” Their paths to the Champions League exist, but they’re narrow, usually requiring a perfect finish and multiple rivals dropping points in clusters.
If you zoom out, the Simulator is telling a simple story: two spots are almost locked, two are still genuinely up for grabs, and a whole group of ambitious clubs are clinging to slimmer but very real statistical lifelines. From here, every small swing, a late equaliser, a key injury, a surprise away win in the rain, nudges those probabilities up or down.
The league table shows what has happened; these numbers sketch out what could happen next.
Cover Photo: Nigel French via Getty Images